Clinical Trials Unit (CTU) participation in NIHR liver disease research partnerships
The following CTUs have prospectively expressed interest in participating in this call. Please use the contact details listed below to connect with a CTU when designing your research partnership.
- Leeds Clinical Trials Research Unit (England) - Professor Deborah Stocken, Director of the Surgical Interventions, Diagnostics & Devices Division. d.d.stocken@leeds.ac.uk
- Barts & The London Pragmatic Clinical Trials Unit (England) - PCTU-enquiries@qmul.ac.uk
- Nottingham CTU (England) - ctu@nottingham.ac.uk
- Sheffield CTRU (England) - Cindy Cooper c.l.cooper@sheffield.ac.uk
- Peninsula Clinical Trials Unit (England) - penctu@plymouth.ac.uk
- Edinburgh Clinical Trials Unit (Scotland) - ECTU@ed.ac.uk. Key contacts: Professor John Norrie (Director), Joyce Thomson (Chief Operating Officer), Dr Agnes Tello (Senior Research Development Manager)
- Liverpool Clinical Trials Centre (England) - lctc@liverpool.ac.uk
- Cancer Research UK Clinical Trials Unit, University of Birmingham (England) - Dr Sian Lax (Clinical Trials Facilitator) newbusiness@trials.bham.ac.uk, Professor Pam Kearns (Director) p.r.kearns@bham.ac.uk
- The Norwich Clinical Trials Unit (England) - Professor Ann Marie Swart a.swart@uea.ac.uk
- Comprehensive Clinical Trials Unit at UCL (England) - Professor Nick Freemantle (Director) nicholas.freemantle@ucl.ac.uk
Research targeting tool - liver disease
Background
The NIHR is keen to support the building of capacity and capability in liver disease research. It wishes to ensure that NIHR research is conducted in geographical areas and with populations where health and social care needs are greatest, increasing the evidence base to improve prevention, diagnosis, treatment, delivery of services and outcomes for people who use health and care services, carers of people in receipt of services, and/or those working in the sector.
Using the information
The data have been gathered from a variety of sources. This is to provide a well rounded overview of available indicators associated with liver disease. It is important to note that indicators are provided at differing geographical levels depending on the source data. Additionally, to supplement the indicator data, we have provided an overview of where current liver disease research is taking place.
We are not the data owners (unless stated), rather, the NIHR has curated the narrative, app and CSV files to enable researchers to access the relevant data in one place.
With thanks to NHS Research Scotland, Health and Care Research Wales and Department of Health Northern Ireland for their support.
Accessibility
The data and insight available on this page have been designed, where possible, to meet the accessibility requirements. We acknowledge that maps may not meet the accessibility requirements and so the data used to generate the maps in this document is available.
Supplementary information
Qlik Sense
Qlik Sense is an analytics platform that allows developers to create visualisations, charts and interactive apps. The Research Targeting Tool (Liver Disease) app contains all the data behind the commentary on this page in addition to more indicators identified as of interest to this area of research.
The app uses a combination of maps and tables to present the data, and text is heavily used to help you identify the appropriate data for your needs.
You are not required to log in to the app, and we have created a short guide to help you navigate Qlik Sense for the first time.
If you are finding it difficult to use the app or you have a question you would like to ask, please use the contact details below.
Data (CSV format)
All the data used in the commentary or Qlik Sense app is available as a CSV file for further analysis.
Contact
For additional support please contact the NIHR Clinical Research Network’s Business Intelligence (BI) Team. This support includes, but is not limited to, questions, feedback and Qlik Sense demonstrations.
England
In total, 12 indicators were identified within England to help researchers understand disease prevalence or associated risk factors. We selected five indicators to provide commentary on. You are able to explore the remaining indicators in the Qlik Sense App or CSV file. If you are unable to access the additional data using these options, please contact the BI Team.
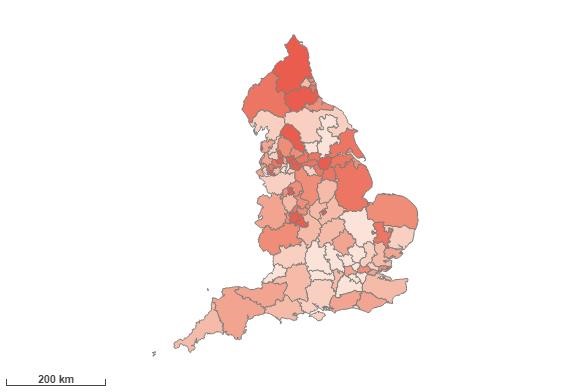
Under 75 mortality rate from liver disease, 2020
Source : Office for Health Improvement & Disparities. Public Health Profiles. Fingertips
Liver disease is one of the top causes of death in England and people are dying from it at younger ages. Most liver disease is preventable and much is influenced by alcohol consumption and obesity prevalence, which are both amenable to public health interventions. This indicators records the number of deaths from liver disease (classified by underlying cause of death recorded as ICD codes B15-B19, C22, I81, I85, K70-K77, T86.4) registered in the respective calendar years, in people aged under 75, aggregated into quinary age bands (0-4, 5-9,…, 70-74).
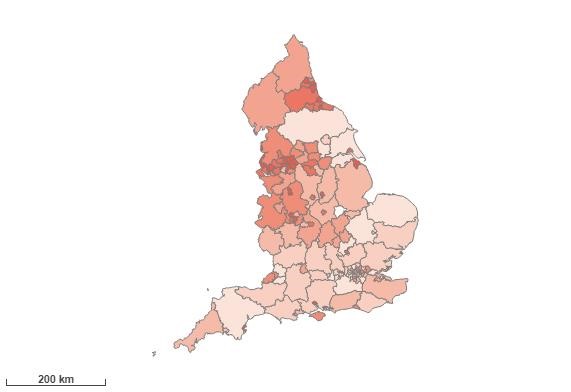
Using Counties and Unitary Authorities (UAs) as the geographical scope, the five areas ranked highest for mortality rates in under 75s from liver disease, in England, are: Blackpool, Oldham, Salford, Rochdale and Manchester.
Heatmap of under 75 mortality rate from liver disease
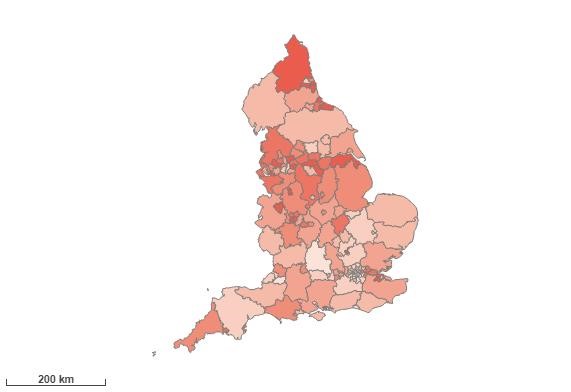
Hospital admission rate for alcoholic liver disease, 2020/21
Source: Office for Health Improvement & Disparities. Public Health Profiles. Fingertips (as linked above)
Liver disease is one of the top causes of death in England and people are dying from it at younger ages. Most liver disease is preventable and much is influenced by alcohol consumption and obesity prevalence, which are both amenable to public health interventions. Number of hospital admissions (Finished Consulted Admission Episodes) due to alcoholic liver disease with a primary diagnosis (DIAG_01) of ICD10 code K70 (any 4th digit). Regular attenders are excluded. Admissions are included and counted according to the financial year in which the admission episode ended.
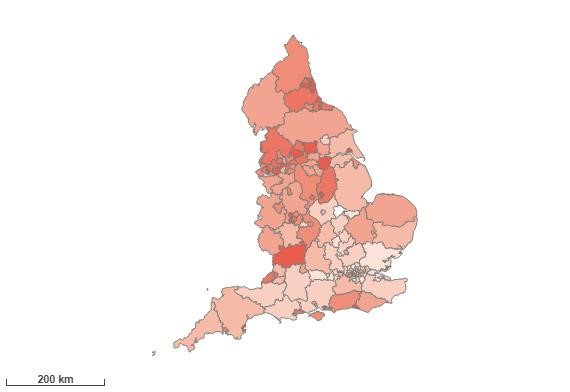
Using Counties and Unitary Authorities (UAs) as the geographical scope, the five areas ranked highest for hospital admission rates for alcoholic liver disease, in England, are: Hartlepool, Salford, Leeds, Sunderland and Kingston upon Hull.
Heatmap of hospital admission rate for alcoholic liver disease
Deprivation score (IMD), 2019
Source: Ministry of Housing, Communities & Local Government
The Indices of Deprivation are a unique measure of relative deprivation across England. Deprivation is measured in a broad way to encompass a wide range of aspects of an individual’s living conditions. The Indices are based on seven different domains, or facets, of deprivation: Income Deprivation, Employment Deprivation, Education, Skills and Training Deprivation, Health Deprivation and Disability, Crime, Barriers to Housing and Services and Living Environment Deprivation.
Using CCGs as the geographical scope, the five areas ranked highest for deprivation, in England, are: NHS Bradford City CCG, NHS Blackpool CCG, NHS Knowsley CCG, NHS Liverpool CCG and NHS Hull CCG.
Heatmap of deprivation Score (IMD)
Diabetes QOF prevalence (17+), 2020/21
Source: Office for Health Improvement & Disparities. Public Health Profiles. Fingertips (as linked above)
The objective of the Quality and Outcomes Framework (QOF) is to improve the quality of care patients are given by rewarding practices for the quality of care they provide to their patients, based on a number of indicators across a range of key areas of clinical care and public health. This indicator is defined as the percentage of patients, aged 17 years and over with diabetes mellitus, as recorded on practice disease registers. This indicator is a measure of recorded prevalence and not actual prevalence.
Using CCGs as the geographical scope, the five areas ranked highest for Diabetes prevalence, in England, are: NHS Leicester City CCG, NHS Black Country and West Birmingham CCG, NHS Bradford District and Craven CCG, NHS Blackburn With Darwen CCGS and NHS Birmingham and Solihull CCG.
Heatmap of diabetes QOF prevalence
Adults (18+) classified as overweight or obese, 2019/20
Source: Office for Health Improvement & Disparities. Public Health Profiles. Fingertips (as linked above)
Excess weight in adults is recognised as a major determinant of premature mortality and avoidable ill health. This indicator records the number of adults aged 18+ with a BMI classified as overweight (including obese), calculated from the adjusted height and weight variables. Adults are defined as overweight (including obese) if their body mass index (BMI) is greater than or equal to 25kg/m2.
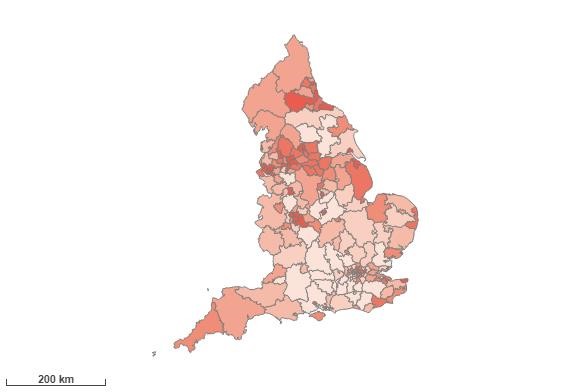
Using Counties and Unitary Authorities (UAs) as the geographical scope, the five areas ranked highest for adults classed as overweight or obese, in England, are: Halton, Sandwell, Stoke-on-Trent, North East Lincolnshire and Dudley.
Heatmap of adults classified as overweight or obese
Additional liver disease indicators
Although not detailed in the commentary, the following indicators have been collated into the CSV file and are presented in the supporting Qlik Sense app. These data were sourced from: Office for Health Improvement & Disparities. Public Health Profiles. Fingertips.
- Admission episodes for alcohol related conditions
- Alcohol related mortality
- Hospital admission rate due to liver disease
- Hospital admission rate for NAFLD
- Mortality from chronic liver disease
- <75 mortality rate from alcoholic liver disease
- <75 mortality rate from NAFLD
Wales
In total, one indicator was identified within Wales to help researchers understand disease prevalence or associated risk factors. We are anticipating further data and will make this available at a later date.
Diabetes QAIF prevalence (17+), 2019/20
Source: Digital Health and Care Wales (DHCW)
The Quality Assurance and Improvement Framework (QAIF) was introduced as part of the General Medical Services (GMS) contract reform for 2019-20. It replaces the Quality and Outcome Framework (QOF), which was originally introduced in 2004 and ceased after 2018-19. This StatsWales cube provides data on the number of patients on active disease registers, the overall number of patients registered at a GP practice and disease prevalence rates, using disease register data obtained through QAIF. These are lists of patients registered with GP practices who have been diagnosed with the medical condition as defined by the QAIF register indicator.
Using Health Boards as the geographical scope, the areas in order of highest ranked for Diabetes Prevalence, in Wales, are: Cwm Taf Morgannwg University Health Board, Aneurin Bevan University Health Board, Hywel Dda University Health Board, Betsi Cadwaladr University Health Board, Swansea Bay University Health Board, Powys Teaching Health Board and Cardiff and Vale University Health Board.
Heatmap of diabetes QAIF prevalence

Northern Ireland
In total, one indicator was identified within Northern Ireland to help researchers understand disease prevalence or associated risk factors. We are anticipating further data and will make this available at a later date.
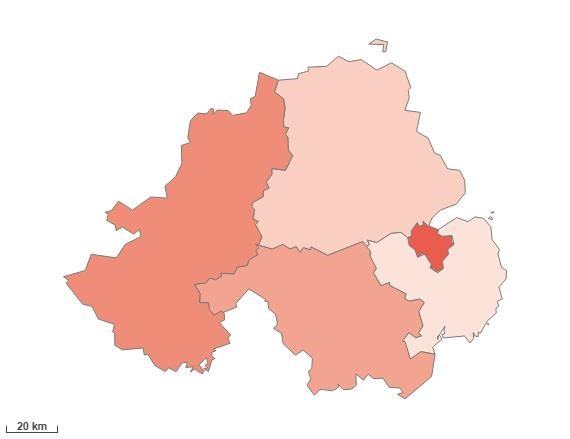
Alcoholic-specific mortality rate, 2020
Source: Northern Ireland Statistics and Research Agency
The annual alcohol-specific deaths, Northern Ireland release presents statistics on the most recent official death registration data available on alcohol-specific mortality across Northern Ireland (NI). Figures in this release relate to deaths registered in Northern Ireland that are known to be direct consequences of alcohol misuse. The definition of alcohol-specific deaths includes any death which has an underlying cause of specific ICD-10 codes.
Using Trusts as the geographical scope, the areas in order of highest ranked for Alcoholic-Specific Mortality Rate, in Northern Ireland, are: Belfast Health and Social Care Trust, Western Health and Social Care Trust, Southern Health and Social Care Trust, Northern Health and Social Care Trust and South Eastern Health and Social Care Trust.
Heatmap of alcoholic-specific mortality rate
Scotland
Notes
In total, three indicators were identified within Scotland to help researchers understand disease prevalence or associated risk factors.
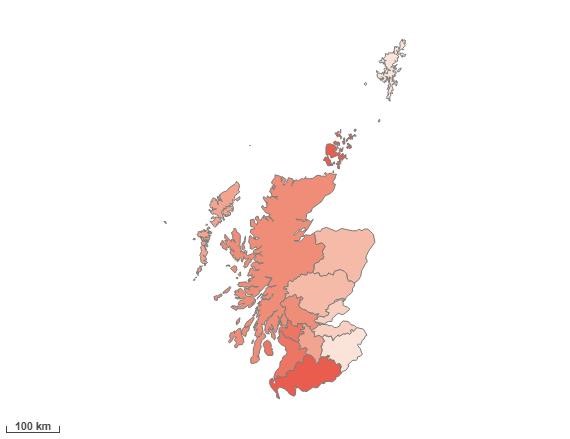
Inpatient stay rate due to other liver disease, 2020/21
Source: The Scottish Morbidity Record (SMR) database
The crude rate per 100,000 population of continuous inpatient stays due to the diagnosis stated in the name. The populations are based on 2020 mid-year population estimates. The data relates to all patients treated by the NHS in Scotland.
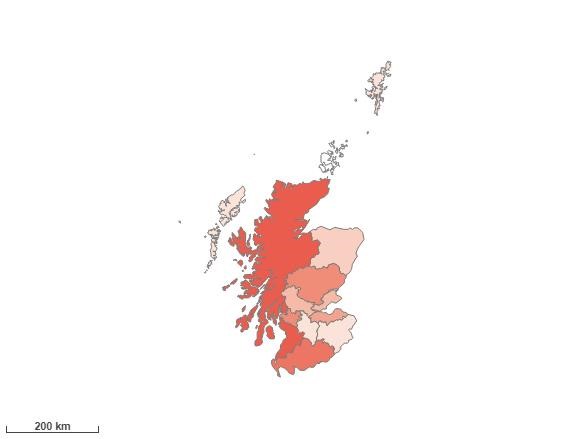
Using Health Boards as the geographical scope, the five areas ranked highest for inpatient stays for other liver disease, in Scotland, are: Orkney, Dumfries and Galloway, Greater Glasgow and Clyde, Ayrshire and Arran and Highland.
Heatmap of inpatient stay rate due to other liver disease
Inpatient stay rate due to alcoholic liver disease, 2020/21
Source: The Scottish Morbidity Record (SMR) database (as linked above)
The crude rate per 100,000 population of continuous inpatient stays due to the diagnosis stated in the name. The populations are based on 2020 mid-year population estimates. The data relates to all patients treated by the NHS in Scotland.
Using Health Boards as the geographical scope,the five areas ranked highest for inpatient stays for alcoholic liver disease, in Scotland, are: Lanarkshire, Western Isles, Orkney, Ayrshire and Arran and Fife.
Heatmap of inpatient stay rate due to alcoholic liver disease

Inpatient stay rate due to viral hepatitis, 2020/21
Source: The Scottish Morbidity Record (SMR) database (as linked above)
The crude rate per 100,000 population of continuous inpatient stays due to the diagnosis stated in the name. The populations are based on 2020 mid-year population estimates. The data relates to all patients treated by the NHS in Scotland.
Using Health Boards as the geographical scope, the five areas ranked highest for inpatient stays for viral hepatitis, in Scotland, are: Ayrshire and Arran, Highland, Dumfries and Galloway, Greater Glasgow and Clyde and Tayside.
Heatmap of inpatient stay rate due to viral hepatitis