Award Funding and Selection Committees Analysis | 2020-21
Executive Summary
At the NIHR, we are fully committed to actively promoting Equality, Diversity and Inclusion (EDI) and addressing inequalities. These are fundamental to our operating principles and areas of strategic focus.
This is our first formal reporting on diversity data. We lacked an effective method for collecting this information, however since we introduced a new Equality and Data Reporting System in early 2020, we have made substantial inroads. What we are presenting in this report is our initial baseline, that forms the benchmark for further reporting, so we can track progress of the EDI actions that are underway. Collecting year on year data will be augmented by collecting additional characteristics, and being able to conduct wider analysis such as intersectionality. This will give us a more robust evidence base and empower us to take more effective action. All of which will form the basis for the continual development of our EDI strategy.
We do understand this is only the beginning of our reporting journey. These initial findings show some encouraging signs of progress across numerous areas, including gender. The representation of women in our research funding is reassuring, and disability is highly represented among public contributors.
However, there are several areas of concern. For example, the proportion of females applying for career awards decreases with the seniority of award, and researchers from ethnic minority backgrounds were less successful for research funding than white applicants. In addition, the data displayed several areas of need for improved diversity within selection committee membership, with variability across the committees and member types. As this benchmark data has enabled us to compare ourselves to other funders, as well as the Higher Education sector, we can see that, on the whole, our challenges are similar. This indicates that wider collaborative efforts are required across the sector to address these challenges.
Key findings
Sex
- The representation of females in research funding applications is encouraging, although they are underrepresented in global health research (GHR) applications.
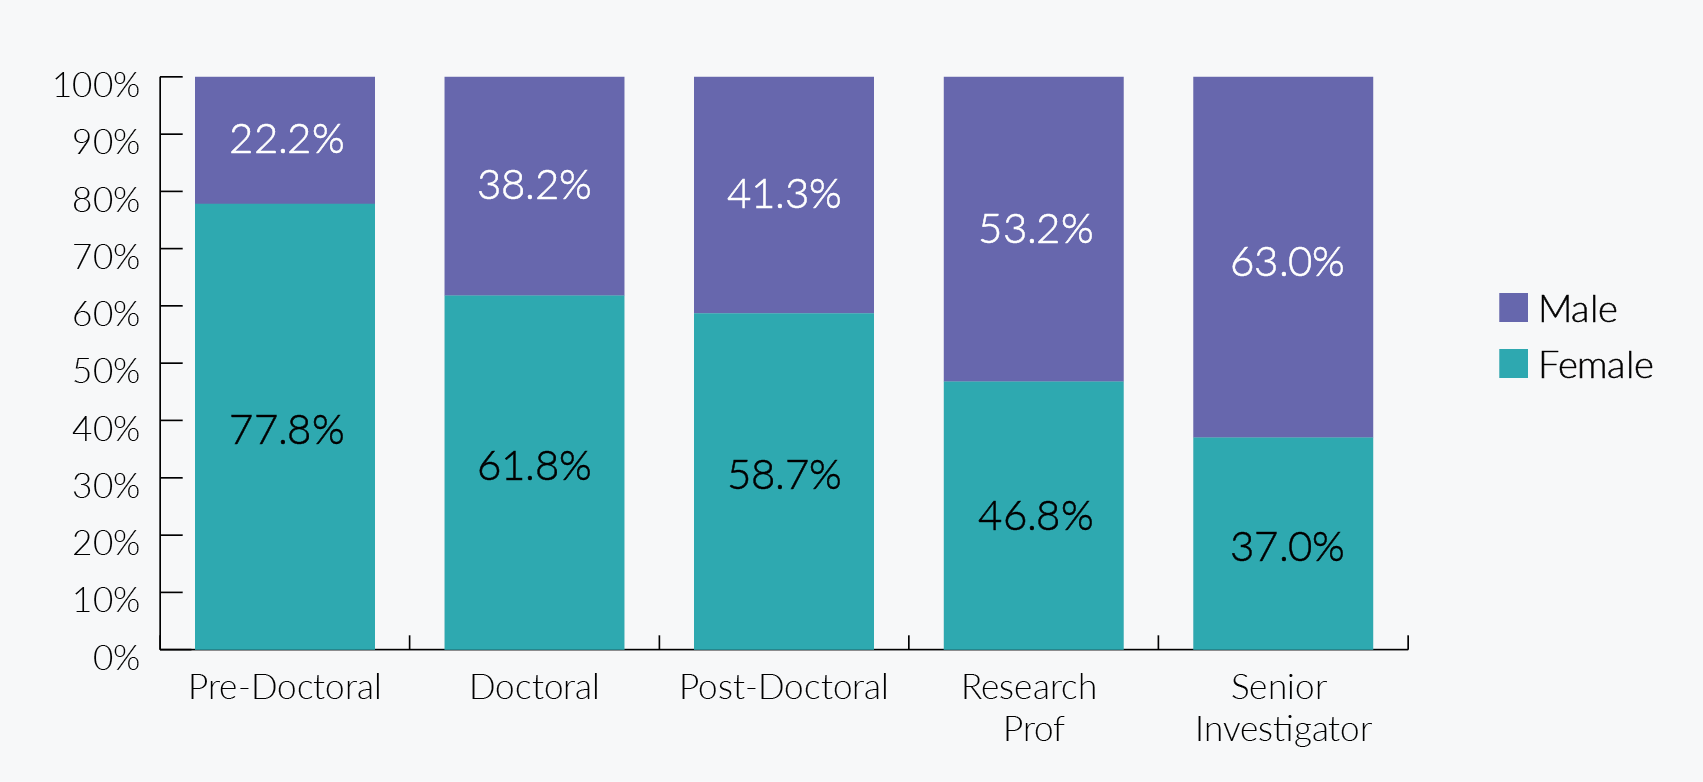
- The proportion of females applying for career awards is very strong at Pre-Doctoral level (77.8%) and although remaining a majority at Doctoral and Post-Doctoral level, decreases along the career path to 46.8% at Research Professorship and 37.0% at Senior Investigator level. A similar pattern is seen with existing career award holders.
- There is substantial variance in the ratio of female to male lead applicant respondents when analysed by specific programme type.
- Females have far stronger representation in career development programmes (62.0%) than research (40.1%).
- Females are moderately underrepresented compared to males when it comes to membership of NIHR selection committees, and marginally more so specific for global health research. By selection committee role, females make up almost two-thirds of public members.
- By specific programme type, the representation of females on selection committees ranges from 27.9% to 71.4%.
Ethnicity
- Overall the representation of ethnic minority groups in applications (20.8%) is similar to the representation for academic staff in NIHR-related disciplines (17.8%).
- Applicants for funding came from across almost all ethnicity types, with the highest representation in global health awards.
- The diversity within the applications across career stages is relatively similar, although across individual programmes the proportion of applications from all other ethnic groups (non-white) ranges from just over 10% to 33.3% for non-GHR programmes.
- Researchers from an ethnic minority background were less successful at being awarded funding for research programmes.
- The percentage of award holders from ethnic minority groups is broadly the same for research and career development programmes, though it declines by career stage, to under 10% for Research Professorships and Senior Investigators.
- The percentage of award holders from all other ethnic groups varies considerably by individual programmes from 7.2% to 28.3%.
- Selection committees have lower representation of ethnic minority groups than funding applicants or award holders.
- Representation is particularly low on selection committees for career development programmes (as low as 7.1% for NIHR Fellowships).
Disability
- The percentages of disabled people applying for funding is similar for career development and research programmes, though representation is higher at Pre-Doctoral level compared to later career stages.
- Application outcomes are practically identical between those who declared a disability and those who did not declare a disability.
- The percentages of award holders with a disability are identical across career development and research.
- The percentage of selection committee members with a disability is over two times higher for research programmes than career development programmes.
- Disabled people are very well represented within the public membership of committees (almost ten times the proportion of professional members).
Age
- Career development lead applicant respondents are on average considerably younger than research applicants, as are existing award holders.
- The average age of funding applicants is relatively consistent with this across all specific programmes, ranging between 46.6 and 52.5 years. These figures are mirrored for award holders, who are marginally older (48.8 to 56.5 years).
- By career stage, there is a demonstrable difference between career development award holders (57.3% are 39 years and under up to Doctoral level, which falls to 15.5% for Post-Doctoral and above).
- On selection committees, the age profiles are similar between career development and research, although public members have an older age profile than professional members.
Key actions
Improving equality and inclusivity of our application process:
To achieve greater equality and inclusivity, it is imperative that we understand the barriers that researchers face when they apply to the NIHR, increase applications from underrepresented groups and better understand any disparities in application outcomes for particular groups.
We have already made some progress, including:
- Reviewing our positive action and accessibility statements to remove any barriers for researchers applying to us and where necessary introducing new policies and interventions.
- Introducing a special mitigating factors section on applications.
- Increasing the use of more inclusive visual imagery and language for funding calls and promotion.
- Empowering institutions to increase diversity by nominating up to 3 individuals to the Research Professorships programme.
- Launching intervention and recruitment campaigns to encourage more applications from groups under-represented on our programmes.
- Building on our progress in tackling gender inequalities (our data shows that women are underrepresented in, and failing to progress, to senior positions).
- Reviewing our initiatives to support and mentor our applicants to ensure that we are retaining talented researchers.
Improving diversity of selection committees:
We have introduced positive action statements and accessibility statements to our committee recruitment process. Widening the reach of recruitment campaigns and advertisements has enabled us to get the most from our academic partnerships, for example with Black British Academics.
We will set diversity targets for our funding committees, to ensure they are more representative of the people that NIHR serves.
Foreword
As the largest funder of health and care research in England, the NIHR has a duty to ensure that we are representative of the society we serve and can benefit from the insights, innovation and creativity its diversity enables. We know that we must do more to embed equality, diversity and inclusion in all our ways of working, nationally and in low and middle-income countries. We will do this by addressing the inequalities in the type of research we fund, who we fund and our decision-making processes, and ensuring a sufficiently diverse range of people to participate in our research studies. Our commitment to equality, diversity and inclusion was highlighted in Best Research for Best Health: The Next Chapter as one of our seven strategic areas of focus where we need to deliver transformative change over the next five to ten years.
We are taking an evidence-led approach. We are grateful to our research community for working with us to provide information to enable an initial baseline report of diversity data for our research and career development funding programmes to be published. We will use and expand this to monitor and evaluate our efforts to improve diversity and inclusion. The findings in this report do not always make for comfortable reading - as the level of representation is perhaps worse for some groups than we might have expected and shows wide variability across our programmes. The disparity in application outcomes related to ethnicity is of particular concern, as is the decreasing proportion of applications from female researchers with increasing seniority.
Several initiatives are already being implemented to address areas of under-representation and these are summarised in this report to raise awareness of them while our strategy for equality, diversity and inclusion is being finalised. We are equipping NIHR’s Head of Equality, Diversity and Inclusion with additional dedicated resources to ensure our ambition can be realised.
NIHR has previously made progress in this area by promoting gender equality in our research workforce through early leadership support for the Athena SWAN Charter and changes in our nomination process for NIHR Research Professorships. We have worked to improve the inclusion of under-served groups in research by providing guidance for researchers (INCLUDE Framework) and promoting opportunities for people to take part in research (Be Part of Research). The COVID-19 pandemic brought into sharp focus those who were disproportionately affected by the virus and we worked closely with the Centre for Ethnic Health Research to promote the importance of participation in COVID-19 research by ethnic minority communities.
We will continue to work with others in higher education and health and care careers to improve our talent pipeline by drawing in new communities of researchers and ensuring they are supported appropriately during their career journey. Our work with other funders on supporting clinical academic careers (Clinical Academic Careers & Training Hub - CATCH) will look to extend these opportunities for researchers and we continue to support other cross-sector initiatives such as the Forum for Tackling Bullying and Harassment and exploring of a shared approach towards a narrative CV.
Data collection and reporting is being extended into other areas of NIHR, with a particular focus on research participant data. As the provider of research infrastructure and training that underpins the work of other research funders, including medical research charities and the life sciences industry, we take seriously our responsibility to ensure diversity reporting in this area is prioritised. We will continue to work with the wider health and care sector including playing a leading role in implementing the vision for The Future for UK Clinical Research Delivery, which contains a key action area of “making research more diverse and more relevant to the whole of the UK.” This includes NIHR working with partners to enable health and care research to be directed to and supported within areas and communities traditionally under-served by research, particularly those with high disease burden, and scoping the use of national datasets to analyse the diversity of research participants.
NIHR diversity data will be reported annually. We know we have more to do and hope that the data in this report and our current actions and approach empower all in our community to work with us in our ambition to redress the imbalances in representation across our sector.
We welcome your involvement through your thoughts and ideas on our approach and offers of support.
Please get in touch with us by contacting edi@nihr.ac.uk.
Prof Lucy Chappell
CEO – NIHR
Chief Scientific Adviser
Department of Health and Social Care
Dr Louise Wood CBE
Deputy CEO – NIHR
Director of Science, Research and Evidence
Department of Health and Social Care
Introduction
It is imperative that the opportunity to participate in meaningful research is accessible to all across health and social care. To deliver on our commitment to support and embed EDI in everything we do, we are taking an evidence-led approach that will help us to develop a learning culture across the NIHR, and ensure that our interventions are sustainable and have an impact. Following the implementation of a new reporting system across the NIHR commissioning centres in early 2020 we are now able to report our first full year of data collection to understand the diversity profile of some of our NIHR research community and advisory workforce – specifically applicants to our funding programmes, our current award holders and our funding selection committee members. Our previous reporting system was not mandatory and not linked to our award management system, which led to response rates too low to provide meaningful data. This first reporting of data sets our benchmark to establish trends and patterns over time. The data outlined here should not be considered definitive, rather the findings resulting from the data should be used to identify opportunities for interventions and areas for prioritisation.
This is the beginning of the NIHR’s phased approach for tackling equality, diversity and inclusion issues within the NIHR and across the research funding sector, and has commenced with a review of data availability for our wider research community and our workforce. In future years, our ambition is to produce the most robust reporting possible on the diversity of all of our research community, including research participants and our research delivery workforce. For example, we piloted collecting data on NIHR coordinating centre staff, who ultimately work for separate employing organisations, and discovered that some organisations didn’t collect data for some of the characteristics we required, which has enabled us to set an objective for 2021/22 to rectify this.
Commitment to ongoing data collection and annual reporting
A key component of our forthcoming EDI Strategy is to develop a data plan with a commitment to improving our data collection and analysis, which will expand to ensure that we are presenting a more complete picture of NIHR funding activities.
If data is unable to be collected by us directly, for infrastructure-type funding awards, for example, we will seek to locate workable data through associated data providers (such as host organisations of our Biomedical Research Centres or the Integrated Academic Training Programme managed by Health Education England).
We will publish our diversity data annually and explore expanding data collection into additional characteristics, including demographics (for example nationality), host organisation/location of funding, award value and award gender and ethnicity pay gaps. Additional data will create a dataset large enough for us to present disaggregated data across all of our analyses. We will make these process and methodology changes in concert with other funders and organisations to ensure consistency of approach.
Key parameters
Who is covered by our data?
The data for our 2020/21 report covers lead applicants for funding for our research programmes and personal career development awards, as well as members of selection committees who make recommendations for funding decisions on these applications. It also includes data for two NIHR Global Health research programmes.
What data did we collect?
In line with the standard approach of other funders we collected and analysed diversity data on four protected characteristics: sex, age, disability and ethnicity. With the latter we provided eighteen options, segmented to match the categories used in wider population data and to ensure minimum numbers for reporting aggregated data were met.
Our methodology
- A new Equality and Data Reporting System was introduced in early 2020 to improve the level of data collection for research applications and the funding process.
- Four characteristics were collected: sex, ethnicity, disability and age (in line with other funders and as defined by the Equality Act 2010).
- Respondents were given three options for sex (male, female and prefer not to say) and disability (yes, no and prefer not to say), two for age (date of birth and prefer not to say) and eighteen ethnicity choices (plus prefer not to say).
- As noted, we provided the option ‘prefer not to say’ as we understand that some individuals may wish not to disclose personal details.
- In line with the approach taken by UK Research and Innovation (UKRI) and Cancer Research UK (CRUK), we created a subset of the Higher Education Statistical Authority (HESA) datasets for cost centres/disciplines relevant to NIHR.
- Population data used to establish data benchmarks was sourced from the Office for National Statistics (ONS).
- Only single characteristics were analysed – we did not employ an intersectionality approach for this data set.
- The time period covered by this report is 1 April 2020 to 31 March 2021 inclusive.
Limitations of the data
- This is only one year of data and this year may have been atypical for applications due to the COVID-19 pandemic.
- We received a relatively high number of prefer not to say for some protected characteristics, for example age, which has affected our ability to generate a complete picture of our diversity profile.
- We have benchmarked using HESA data but caution should be used when making comparisons to HESA given that our data is only a snapshot for a given period during a potentially atypical year, whereas HESA data has evolved over time. Benchmarking figures should be used to support the interpretation of the data.
- Comparator data uses some data subsets/segmentation that differ from ours. Many of these variances are a result of their longer experience in this area, or the volume of their collected data. In addition, their organisational remits and active sector profiles do not match ours. Some, such as Wellcome Trust, analyse their data against set targets. Others, such as Cancer Research UK, segment their respondents differently.
The effect of ‘prefer not to say’ responses
As displayed below, we received a relatively high number of prefer not to say for some protected characteristics. This has made it more difficult to fully understand our diversity profile. This was particularly acute when it came to age, and may be a result of directly asking for date of birth, as opposed to providing a selection of age ranges to choose from. Using this experience, we will attempt to address this discrepancy in future reporting.
How are we presenting this data?
As the number of respondents for our first year of reporting was limited, we have chosen to present aggregated data covering the entire NIHR portfolio, segmented by ‘research’ and ‘career development programmes’. We have also reviewed NIHR without our Global Health Research (GHR) portfolio. Where responses were adequate, we analysed the GHR portfolio itself.
The analysis of all four characteristics (sex, ethnicity, disability, age) has been segmented against these three categories of respondents:
- Applications for funding (in progress) and application outcomes
- Award holders (current and active)
- Selection committee members
Where there is little or no variation in findings across different sub-groups, we will not present this data in chart form. It will be highlighted in the text.
| Subgroup | Prefer Not to Say (PNTS) Responses | Invalid date of birth responses | |||
|---|---|---|---|---|---|
| NIHR Data: | Sex | Ethinicity | Disability | Age | Age |
| No. (%) | No. (%) | No. (%) | No. (%) | No. (%) | |
| Lead Applicants | 125 (3.9%) | 170 (5.3%) | 140 (4.4%) | 451 (14.3%) | 50 (1.6%) |
| Award Holders | 81 (4.5%) | 96 (5.3%) | 107 (5.9%) | 297 (16.6%) | 24 (1.3%) |
| Committee Members | 33 (2.8%) | 40 (3.3%) | 33 (2.8%) | 155 (13.6%) | 61 (5.1%) |
Data Findings and Actions
Applications for Funding
Lead applicants
This group is defined as lead applicants (and those with an equivalent status, i.e. joint lead applicants) who submitted for NIHR research or career development funding during our 2020/21 financial year (1 April 2020 to 31 March 2021).
Only distinct applications have been counted. For applications following a two-stage process, inclusion here is based on the submission date for the stage 1 application. Any subsequent submissions for the same research proposal have been excluded.
In the instance when an individual submitted more than one distinct application in our 2020/21 financial year period (according to the criteria already described), their EDI data will be counted for each such application. For example, if they submitted 3 distinct applications during this period, their EDI response will be counted 3 times in the dataset.
Only programmes with an annual (or more frequent) funding application process have been included. The following are not included in this reporting year as they were out of scope for the data collection system implementation in this period:
- Applications for Artificial Intelligence awards
- Applications for Global Health Policy and Systems Research awards
- Evidence Synthesis Programme incentive awardsEvidence awards
- Applications for devolved nations funded awards within career development programmes
| Programmes | Total records in scope | Total EDI responses available | Percentage of records covered |
|---|---|---|---|
| Research Programmes | 2718 | 2155 | 79.3% |
| Career Development Programmes | 1060 | 1039 | 98.0 % |
| All Programmes | 3778 | 3194 | 84.5% |
Applications for funding – sex
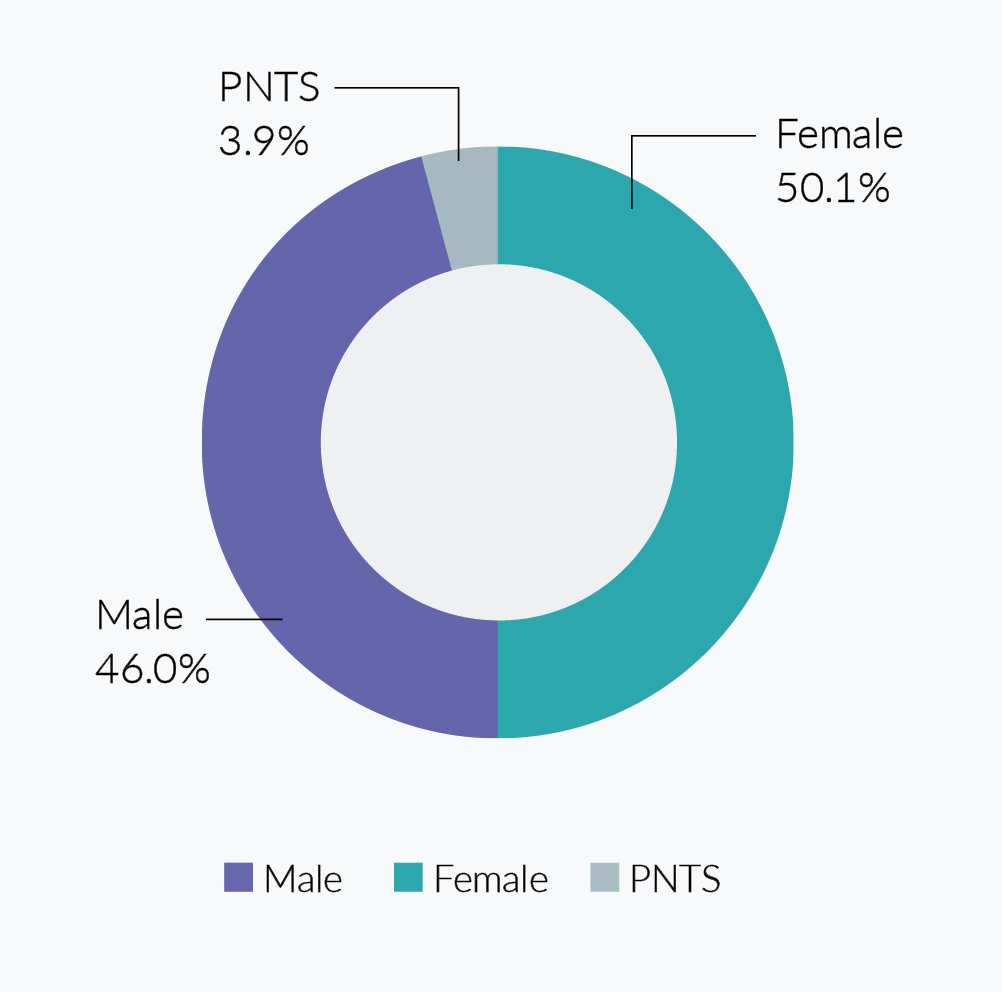
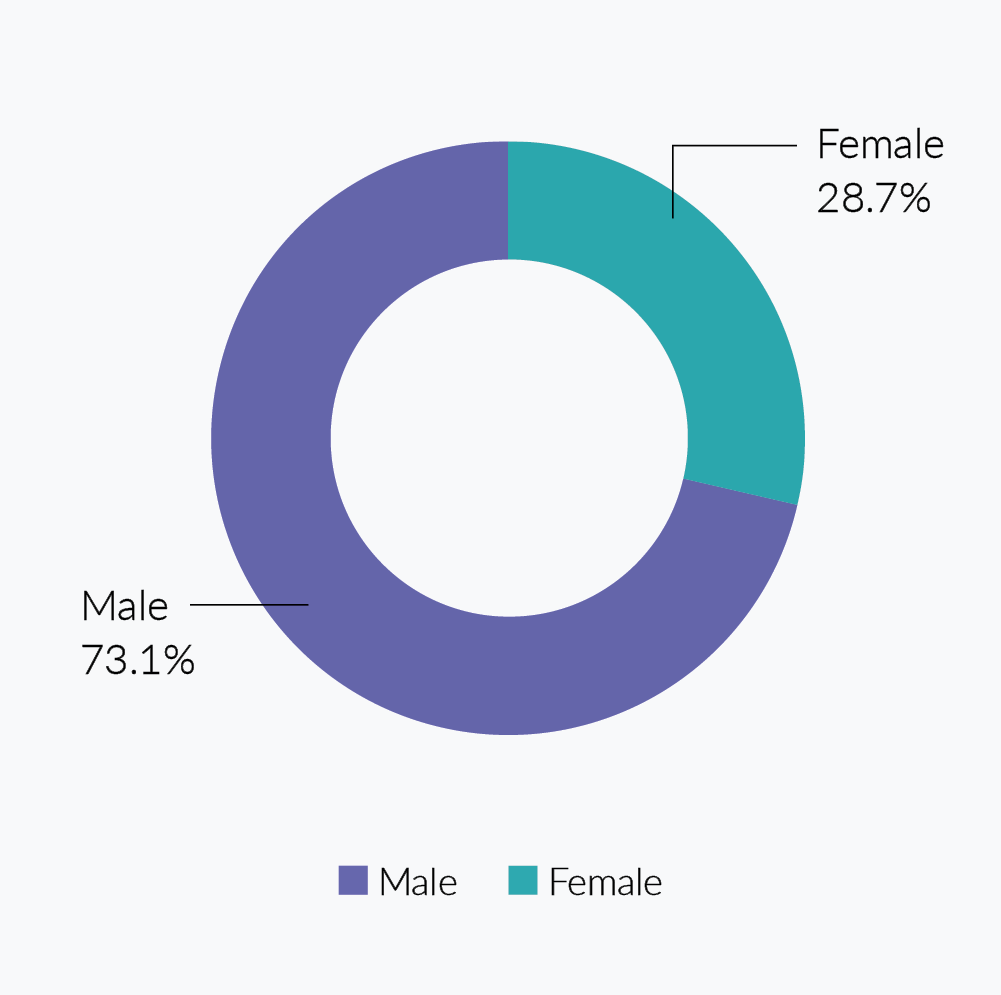
Responders were able to choose from three options: ‘Male’, ‘Female’ and ‘Prefer not to say’. 50.1% of all lead applicant respondents in 2020/21 were female and 46.0% were male. The percentage of NIHR lead applicants who are female is broadly consistent with HESA staff data (52.3%). When global health lead applicant responders are excluded, the change is negligible – 50.8% female to 45.1% male. However, when looking at global health lead applicant responders alone, the percentage of females is considerably smaller – 28.7% female to 71.3% male. Although the number of GHR responders made up a relatively small number of overall lead applicants, it still shows that females are underrepresented in GHR lead applications.
NIHR Lead Applicants by Sex n = 3194
A pie chart showing 46.0% male, 50.1% female and 3.9% prefer not to say, from a sample of 3194.
NIHR GHR Lead Applicants by Sex n = 108
A pie chart showing 73.1% male and 28.7% female from a sample of 108.
Applications for funding – sex by programme type and career stage
Lead Applicants by Programme Type
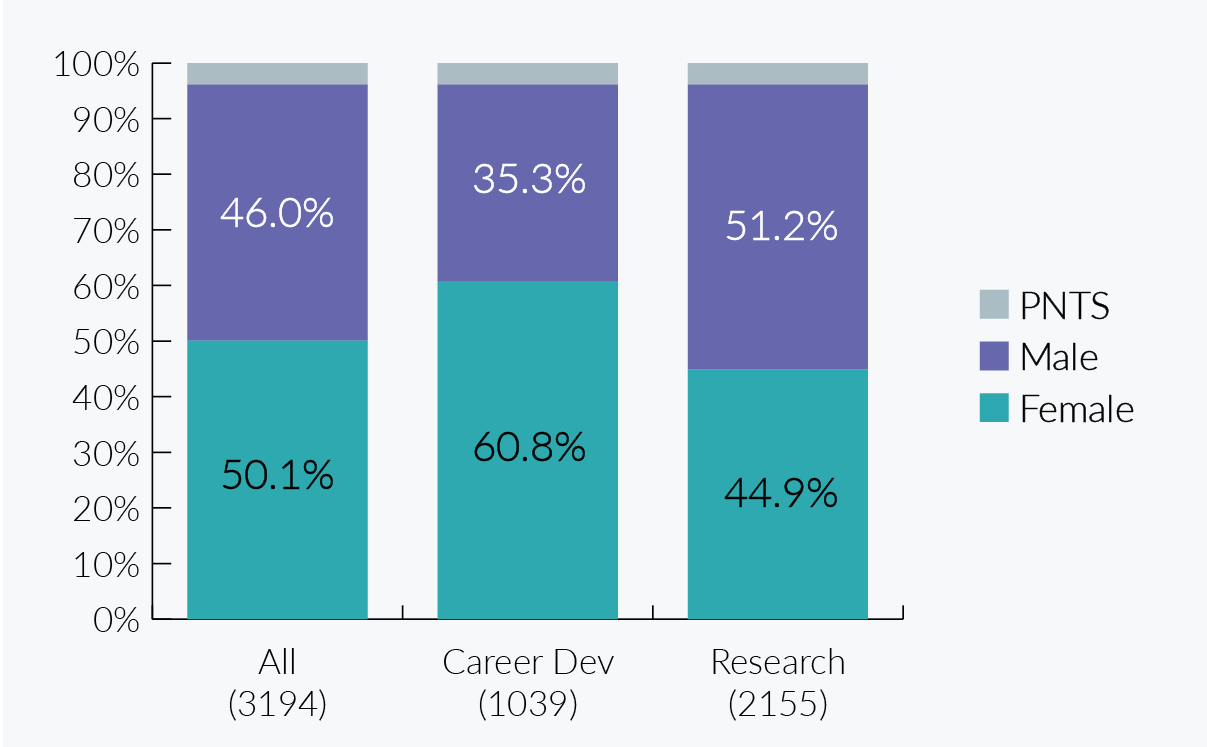
Females make up a noticeably higher percentage of lead applicant respondents than men for career development programmes, both overall and when GHR applicants are excluded. When all applications are considered, the proportion of female NIHR lead applicants compares favourably with HESA staff in NIHR related areas (52.3%). This is true both overall and without GHR data. Response numbers for global health lead applicants do not meet the agreed minimum requirements for reporting aggregated data so we cannot provide a global health career development / research split.
NIHR Lead Applicants by Sex by Programme Type
A bar chart showing:
All lead applicants 50.1% female and 46.0% male from a sample of 3194.
Career development 60.8% female and 35.3% male from a sample of 1039.
Research 44.9% female and 51.2% male from a sample of 2155.
Career Development by Career Stage
The proportion of female applicants declines as the career stage advances both overall and when GHR responses are excluded. For this analysis, PNTS responses were excluded as their numbers did not meet the agreed minimum for reporting aggregated data. With only 16 career development lead applicant responses for global health, it was not possible to establish a meaningful comparison for this group.
NIHR Career Development Lead Applicant by Sex by Career Stage n=999
A bar chart with a sample size of 999 showing:
Pre-Doctoral 77.8% female and 22.2% male.
Doctoral 61.8% female and 38.2% male.
Post-Doctoral 58.7% female and 41.3% male.
Research Professionals 46.8% female and 53.2% male.
Senior Investigator 37.0% female and 63.0% male.
Applications for funding – sex by specific programme type
The relative proportions of female and male lead applicant respondents across research and career development programmes show considerable variance, from 24.9% female (Invention for Innovation Research Programme) to 76.3% female (HEE/NIHR Integrated Clinical Academic Programme). We only reported the splits for individual programmes when we reached the agreed minimum requirements for reporting aggregated data. PNTS responses were excluded to maximise the number of programmes for which data could be presented.
The first programme type listed – Cross Programme – refers to research briefs inviting proposals in a particular topic area which has been highlighted as a priority for research by two or more NIHR programmes. If an applicant’s proposal spans the remit of two programmes, the application may be submitted for joint consideration.
NIHR Lead Applicants by Sex by Specific Programme Type
Research
| Programme | Number of respondents | Female (%) | Male (%) |
|---|---|---|---|
| Cross Programme | 163 | 50.9% | 49.1% |
| Efficacy and Mechanism Evaluation (EME) | 47 | 27.7% | 72.3% |
| Health Services and Delivery Research (HSDR) | 127 | 59.8% | 40.2% |
| Health Technology Assessment (HTA) | 221 | 34.4% | 65.6% |
| Invention for Innovation (i4i) | 284 | 24.3% | 75.7% |
| Policy Research Programme (PRP) | 268 | 59.0% | 41.0% |
| Programme Development Grants (PDG) | 54 | 53.7% | 46.3% |
| Programme Grants for Applied Research (PGfAR) | 63 | 46.0% | 54.0% |
| Public Health Research (PHR) | 160 | 58.1% | 41.9% |
| Research for Patient Benefit (RfPB) | 590 | 53.7% | 46.3% |
Career Development
| Programme | Number of respondents | Female (%) | Male (%) |
|---|---|---|---|
| HEE/NIHR Integrated Clinical Academic Programme | 270 | 76.3% | 23.7% |
| NIHR Fellowships | 559 | 61.7% | 38.3% |
| NIHR Integrated Academic Training Programme | 23 | 52.2% | 47.8% |
| NIHR Professorships (Excluding GHR) | 31 | 48.4% | 51.6% |
| Senior Investigator | 81 | 37.0% | 63.0% |
NIHR (GHR) Lead Applicants by Sex by Programme Type
| Programme | Number of respondents | Female (%) | Male (%) |
|---|---|---|---|
| Research and Innovation for Global Health Transformation | 92 | 26.1% | 73.9% |
Applications for funding – ethnicity
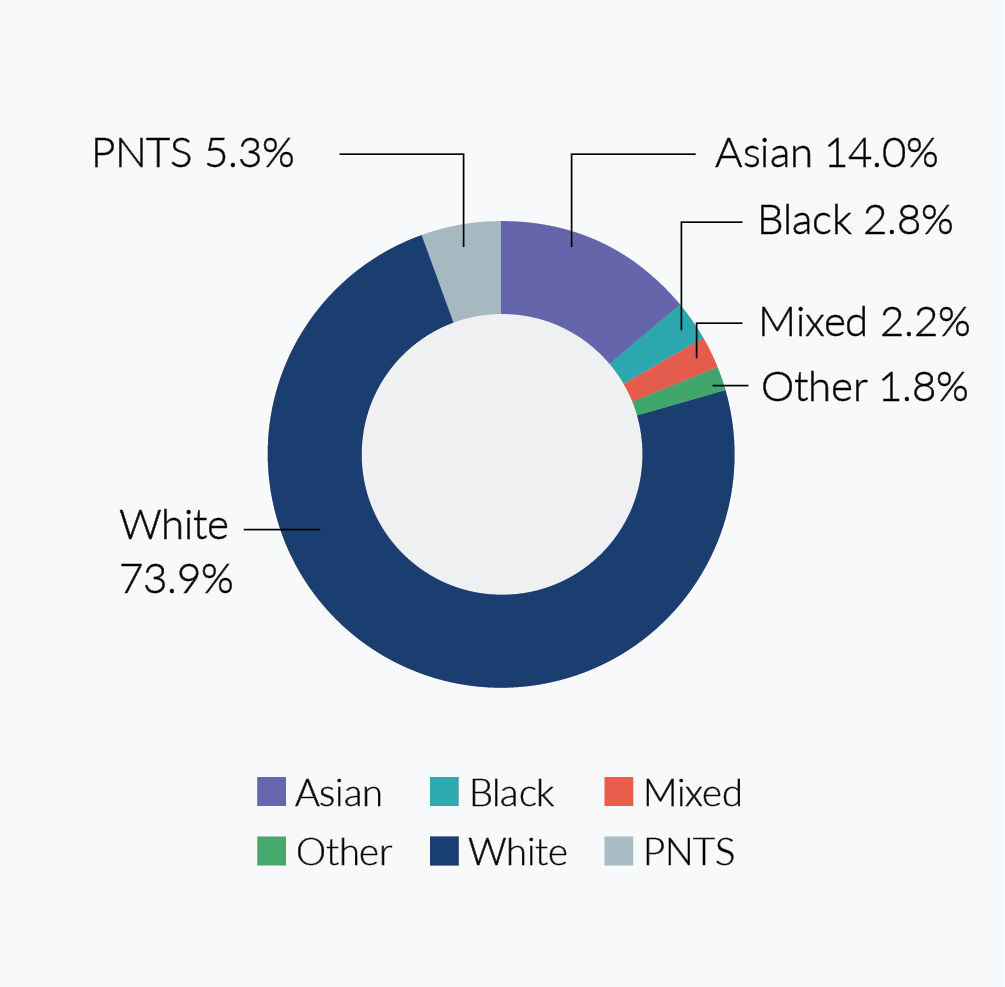
Respondents could choose from a selection of eighteen ethnicity options, or select ‘Prefer not to say’. Two categories had zero responses – ‘White - Gypsy or Irish Traveller’ and ‘Mixed/Multiple Ethnic Groups - White and Black Caribbean’. All other options are present in the dataset. Please note, ‘White’ includes white minority ethnicities.
73.9% of all lead applicant respondents were white and 20.8% were from other ethnic groups combined. When GHR responses are excluded, the proportion of respondents answering ‘White’ was slightly higher at 75.1% (with those from other ethnic groups at 19.4%). The proportion of lead applications from other ethnic groups was demonstrably higher for global health awards (60.2% versus 19.4%). For global health, numbers for some ethnicity categories do not meet the agreed minimum for reporting aggregated data, so data has been rounded as per convention.
NIHR Lead Applicants by Ethnicity n = 3194
A pie chart with a sample size of 3194 showing 73.9% white, 14.0% Asian, 2.8% black, 2.2% mixed, 1.8% other and 5.3% prefer not to say.
NIHR (GHR) Lead Applicants by Ethnicity n = 105
| Ethnicity | Number of responses (rounded) |
|---|---|
| Asian | 30 |
| Black | 25 |
| Mixed | # |
| Other | 10 |
| White | 40 |
| PNTS | # |
Applications for funding – ethnicity by programme type and career stage
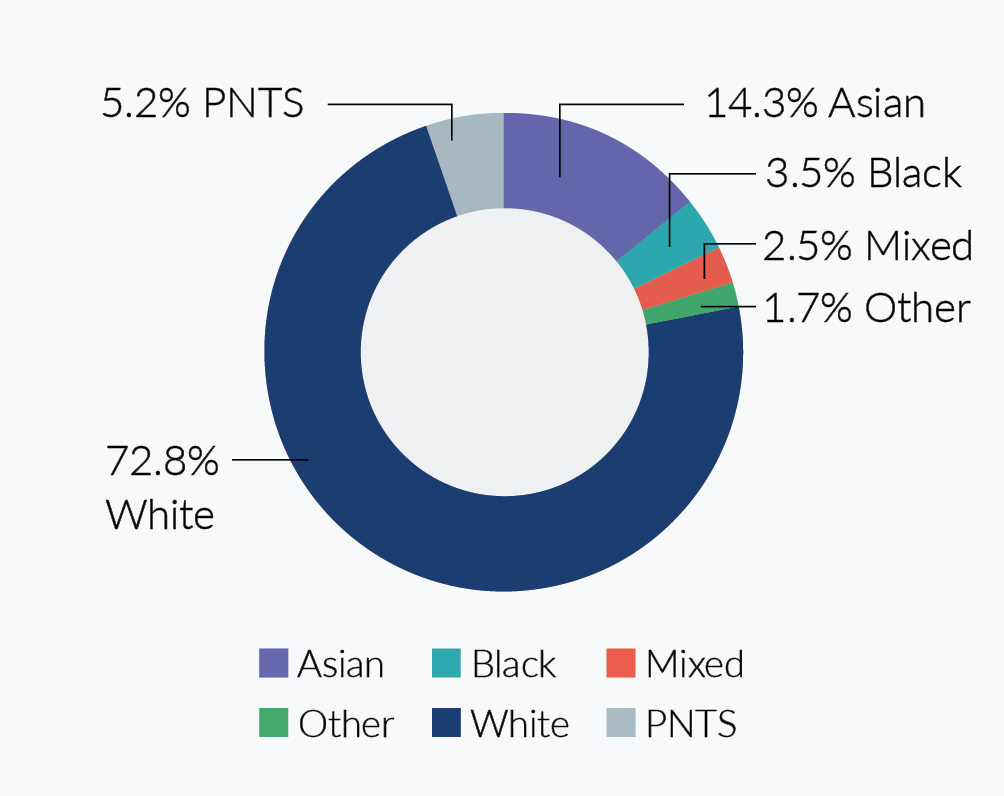
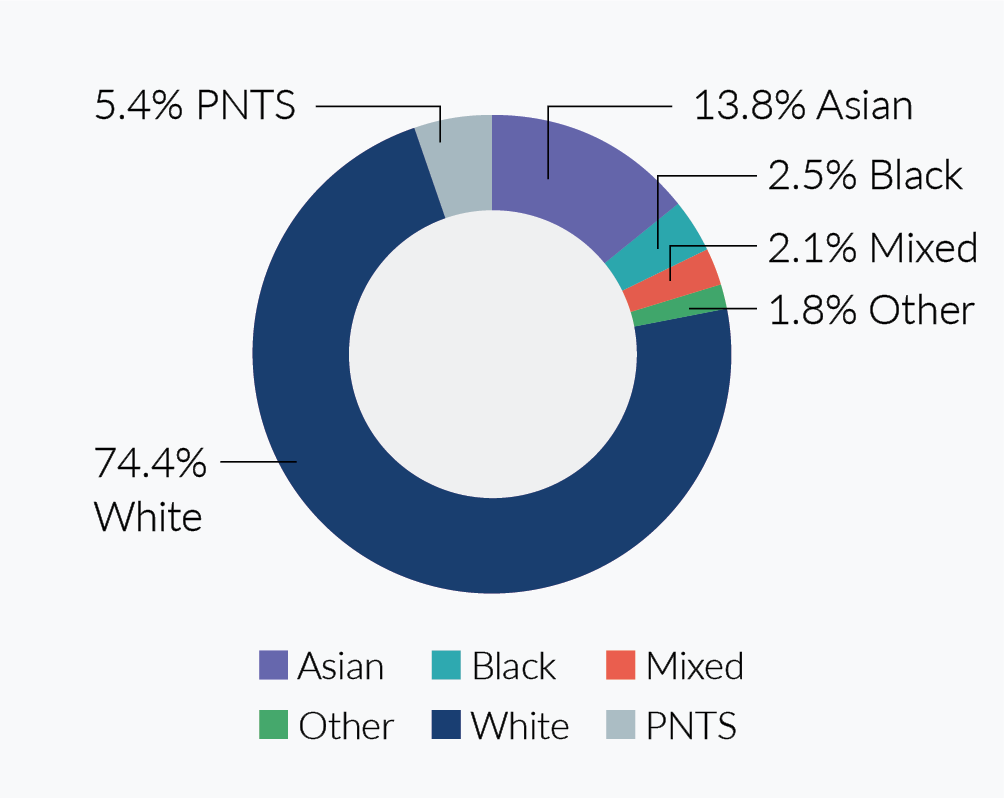
The percentage of all lead applicant respondents from other ethnic groups combined is 22.0% for career development programmes and 20.2% for research. When GHR awards are excluded, these numbers make a negligible change (21.9% and 18.2% respectively). The percentages for more detailed ethnicity categories are broadly consistent across programme types with Asian the second most common ethnicity after White in both cases.
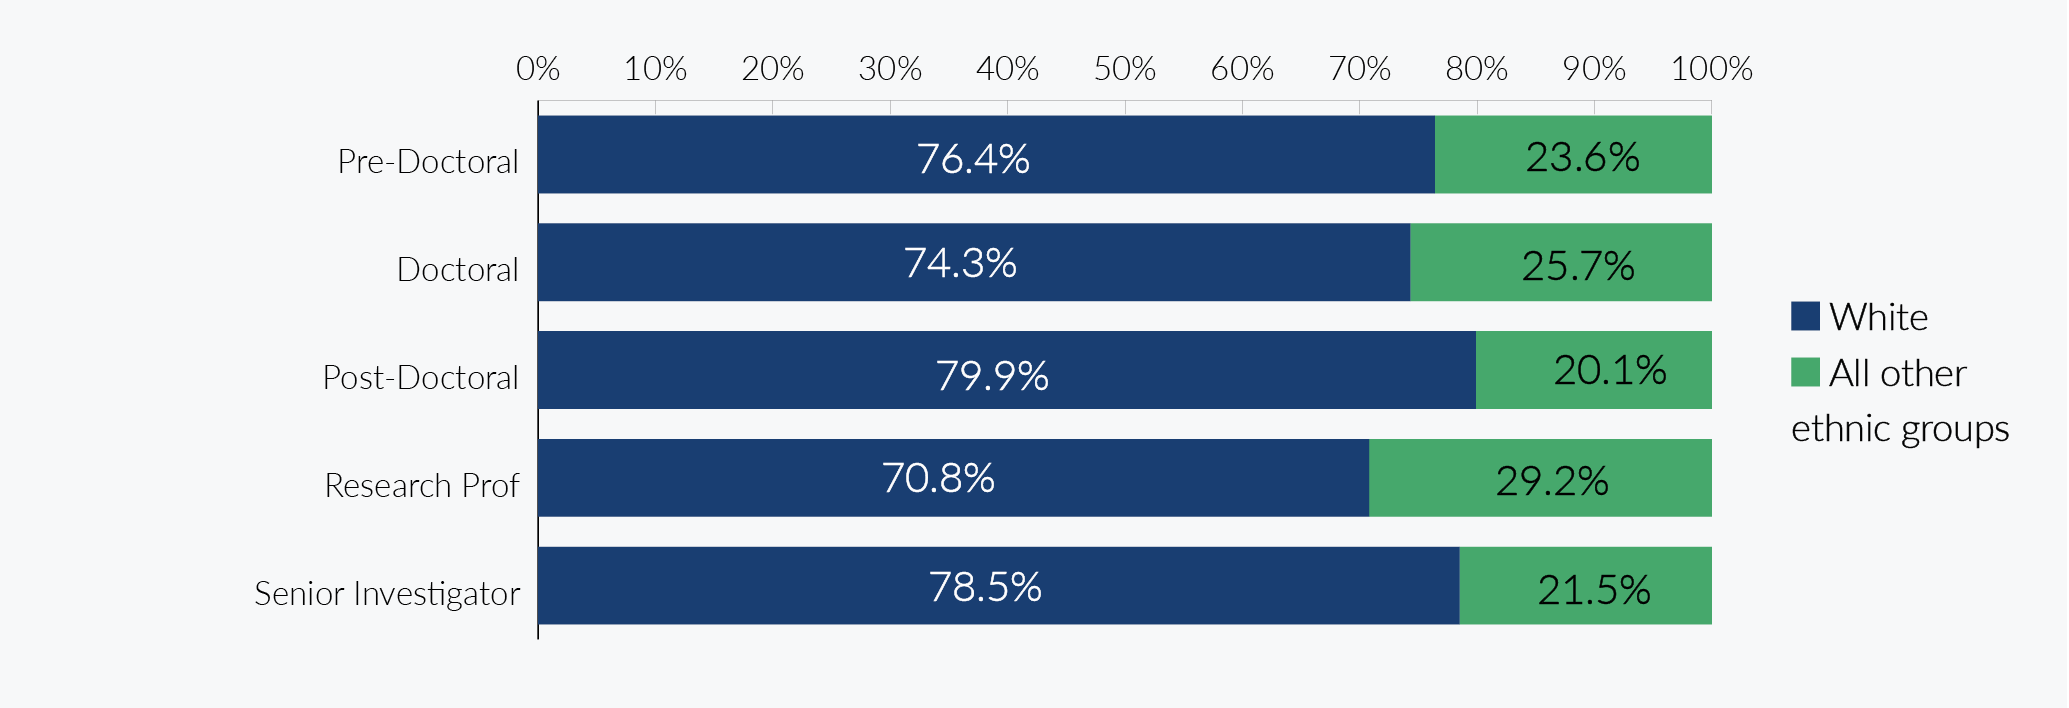
Concerning career development lead applications by career stage, the proportion of respondents from other ethnic groups is varied, with Research Professor awards attracting the highest proportion of ethnic minority applicants and post-doctoral Awards attracting the lowest. However, once global health responses are removed, doctoral awards become the category with the highest percentage of applicants from other ethnic groups. Note that for this particular analysis, PNTS responses were excluded as the numbers for this category did not comply with the agreed minimum for aggregated data recording.
NIHR Lead Applicant Ethnicity – Career Development n = 1039
A pie chart with a sample size of 1039 showing 72.8% white, 14.3% Asian, 3.5% black, 2.5% mixed, 1.7% other and 5.2% prefer not to say.
NIHR Lead Applicant Ethnicity – Research n = 2155
A pie chart with a sample size of 2155 showing 74.4% White, 13.8% Asian, 2.5% black, 2.1% mixed, 1.8% other and 5.4% prefer not to say.
NIHR Career Development Lead Applicant Ethnicity by Career Stage n = 985
A graph with a sample size of 985 showing:
Pre-Doctoral at 76.4% white and 23.6% all other ethnic groups
Doctoral at 74.3% white and 25.7% all other ethnic groups
Post-Doctoral at 79.9% white and 20.1% all other ethnic groups
Research Professor at 70.8% white and 29.2% all other ethnic groups
Senior Investigator at 78.5% white and 21.5% all other ethnic groups
Applications for funding – ethnicity by programme
This lead applicant ethnicity data is broken down by Career Development and Research (both excluding GHR and GHR-specific). Programme ethnicity ratios can only be reported where the number of responses for each category meets the agreed minimum requirements for reporting aggregated data. PNTS responses have also been excluded to maximise the number of programmes for which data could be presented.
Across all NIHR programmes where data could be reported, the percentage of lead applicants from other ethnic groups ranged from 10.6% (Public Health Research) to 67.4% (Research and Innovation for Global Health Transformation), although when the latter is excluded, the range is 10.6% to 33.3%. These numbers compare favourably to HESA, where the percentage of all other ethnic groups in NIHR-related disciplines for academic staff is 16% (and 23.4% for postgraduate students).
NIHR Lead Applicant Ethnicity by Programme
| Programme | Number of Responses (Excluding PNTS) | White | All Other Ethnic Groups |
|---|---|---|---|
| Career Development (Excluding GHR) | |||
| HEE/NIHR Integrated Clinical Academic Programme | 265 | 84.5% | 15.5% |
| NIHR Fellowships | 550 | 73.5% | 26.5% |
| NIHR Integrated Academic Training Programme | 24 | * | * |
| NIHR Pre-doctoral Local Authority Fellowship | 19 | * | * |
| NIHR Professorships (Excluding GHR) | 32 | * | * |
| Senior Investigator | 79 | 78.5% | 21.5% |
| Career Development (GHR) | |||
| NIHR Professorships (GHR) | 16 | * | * |
| Research (excl GHR) | |||
| Cross Programme | 160 | 77.5% | 22.5% |
| Efficacy and Mechanism Evaluation | 45 | 66.7% | 33.3% |
| Evidence Synthesis Programme | 1 | * | * |
| Health Services and Delivery Research | 127 | 88.2% | 11.8% |
| Health Technology Assessment | 220 | 76.4% | 23.6% |
| Invention for Innovation | 275 | 74.5% | 25.5% |
| Policy Research Programme | 269 | 84.0% | 16.0% |
| Programme Development Grants | 53 | * | * |
| Programme Grants for Applied Research | 63 | 81.0% | 19.0% |
| Public Health Research | 161 | 89.4% | 10.6% |
| Research for Patient Benefit | 576 | 80.7% | 19.3% |
| Research (GHR) | |||
| Research and Innovation for Global Health Transformation | 89 | 32.6% | 67.4% |
* Indicates that the number of responses for one or more categories was less than 10 and so cannot be reported.
Applications for funding – disability
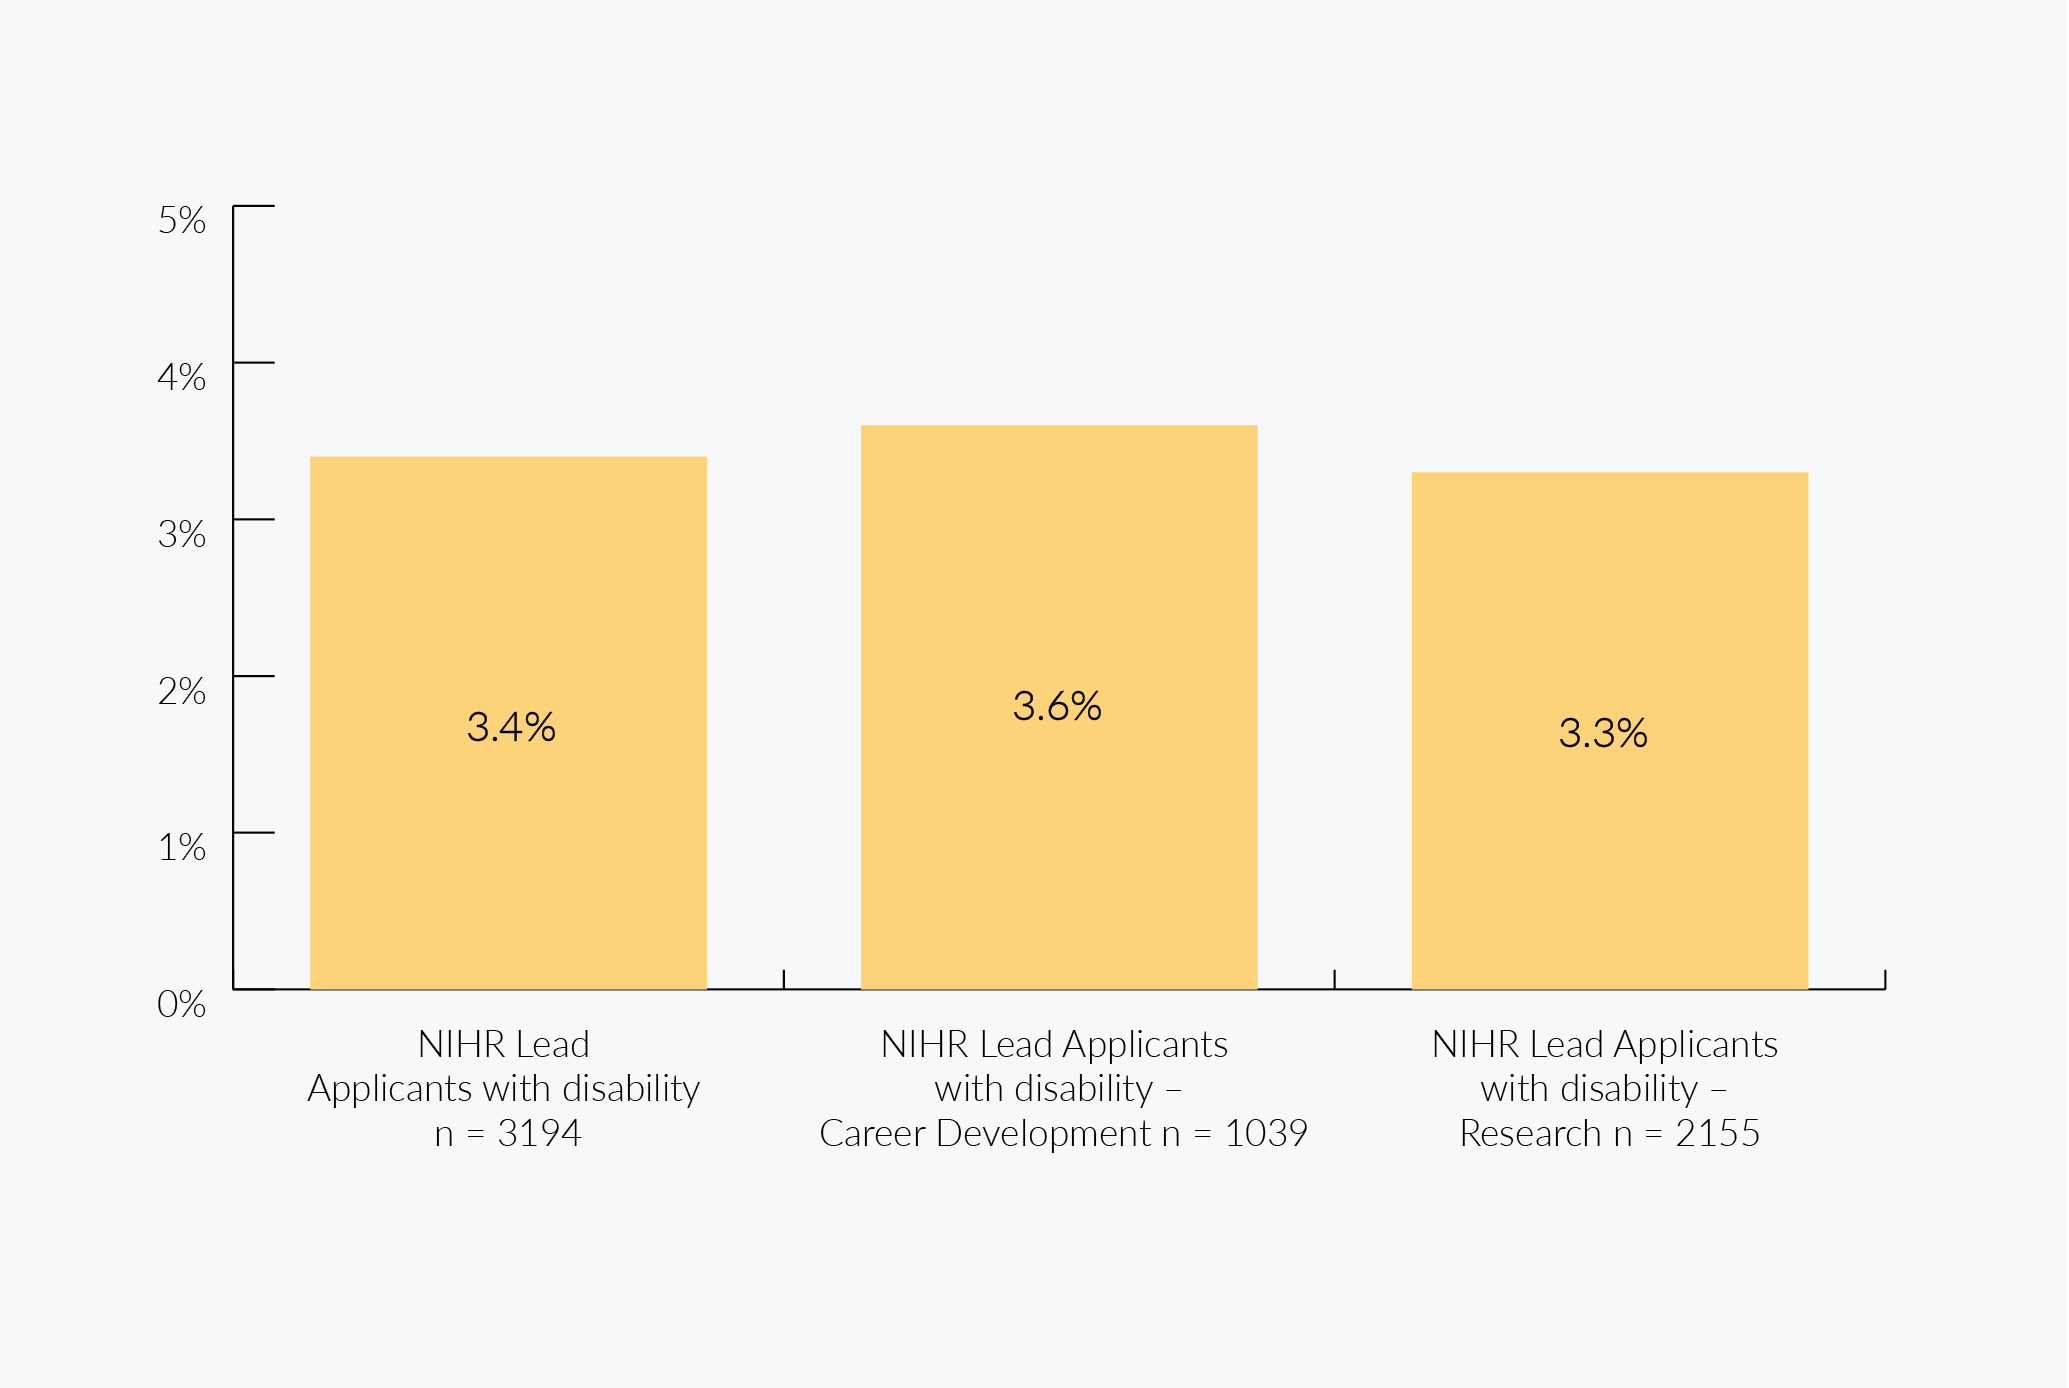
Respondents could choose from the following three answers: ‘Yes’; No’ and ‘Prefer not to say’. 3.4% of all lead applicant respondents for 2020/21 had a disability and 92.2% did not. These disability numbers are similar to HESA data for academic staff in NIHR areas (4.5%). When GHR numbers are excluded, the results are very similar. PNTS responses were excluded and career stages were combined to ensure aggregated data requirements were met.
The proportion of respondents with a disability appears to fall as the career stage advances. At Pre-Doctoral level, the number is 5.1%, while at Doctoral level and above, it is 3.1%. This is true of both the overall dataset and non-GHR lead applicants.
Due to the minimum requirements for reporting aggregated data, no further breakdown by career stage or research programmes can be provided.
NIHR Lead Applicant Disability by Programme Type
A bar chart showing:
All lead applicants with a disability 3.4% of a sample of 3194.
Career development lead applicants with a disability 3.6% from a sample of 1039.
Research lead applicants with a disability 3.3% from a sample of 2155.
Applications for funding – age and by career stage for career development
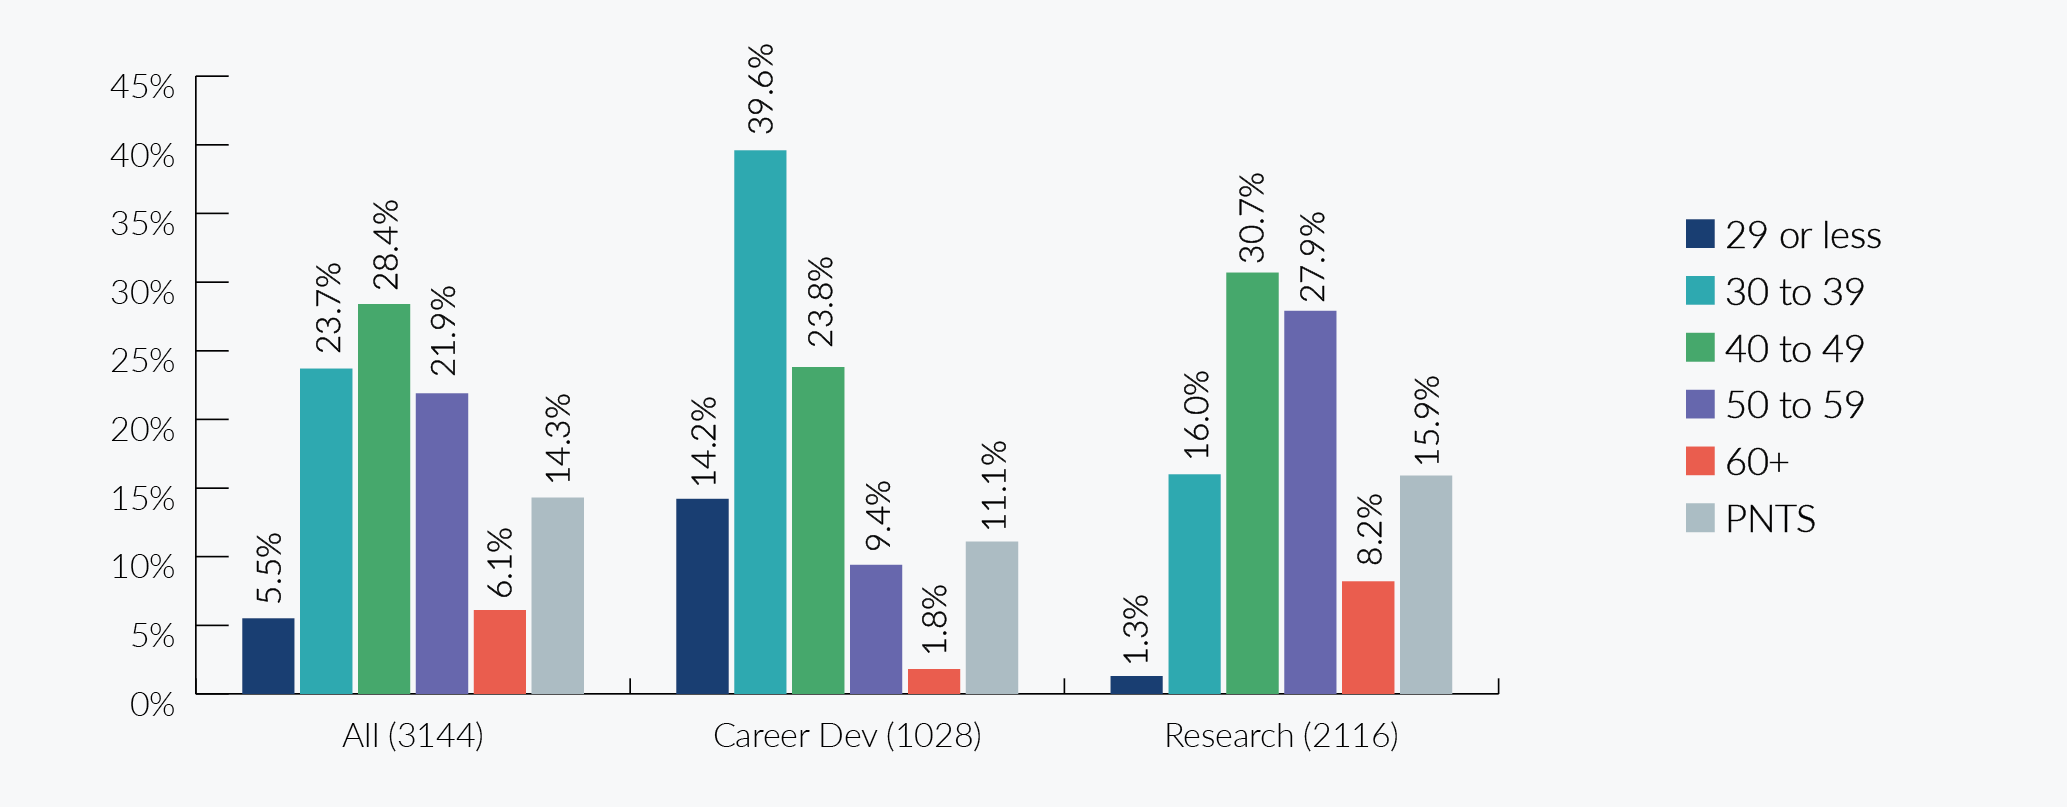
Career development lead applicant respondents are on average considerably younger (38.8 years) than research applicants (48.1 years). 39.1% of the former are aged 30-39, whereas for the latter that number falls to 30.7%. These differences are magnified in the 29 and under age group. Just over 1% of research applicants come from this group, as opposed to 14.2% for career development.
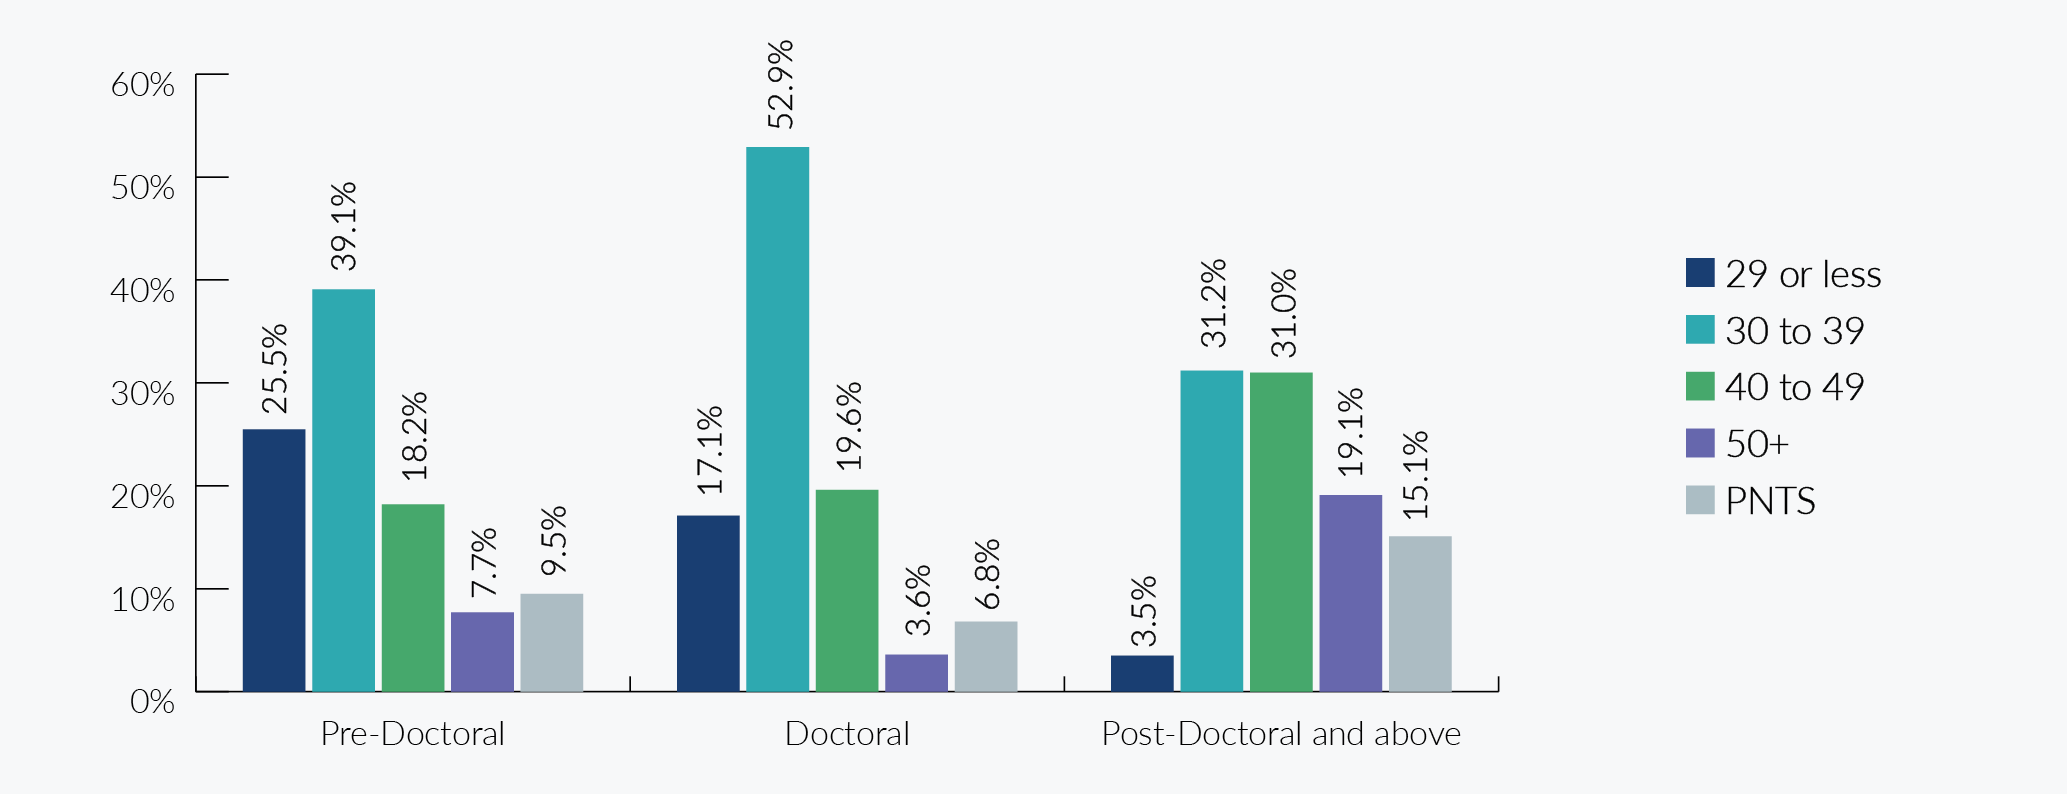
As career stage advances (overall and when GHR is excluded), an older age profile becomes apparent, as may be expected. The majority of Pre-Doctoral and Doctoral applicants are aged under 40 (64.6% and 70% respectively) whereas for all post-doctoral and above awards the comparable figures are 34.7% (36.1% when GHR data is excluded).
NIHR Lead Applicant Age by Programme Type
A bar chart showing lead applicants by age, all programme types 5.5% 29 or less, 23.7% 30 to 39, 28.4% 40 to 49, 21.9% 50 to 59, 6.1% 60+, 14.3% prefer not to say, from a sample of 3144.
A bar chart showing career development lead applicants by age, 14.2% 29 or less, 39.6% 30 to 39, 23.8% 40 to 49, 9.4% 50 to 59, 1.8% 60+, 11.1% prefer not to say, from a sample of 1028.
A bar chart showing research lead applicants by age, 1.3% 29 or less, 16.0% 30 to 39, 30.7% 40 to 49, 27.9% 50 to 59, 8.2% 60+, 15.9% prefer not to say, from a sample of 2116.
NIHR Career Development Lead Applicant Age by Career Stage n = 1028
A bar chart showing Pre-Doctoral lead applicants by age, all programme types, 25.5% 29 or less, 39.1% 30 to 39, 18.2% 40 to 49, 7.7% 50+, 9.5% prefer not to say.
A bar chart showing Doctoral lead applicants by age, all programme types, 17.1% 29 or less, 52.9% 30 to 39, 19.6% 40 to 49, 3.6% 50+, 6.8% prefer not to say.
A bar chart showing Post-Doctoral and above lead applicants by age, all programme types, 3.5% 29 or less, 31.2% 30 to 39, 31.0% 40 to 49, 19.1% 50+, 15.1% prefer not to say.
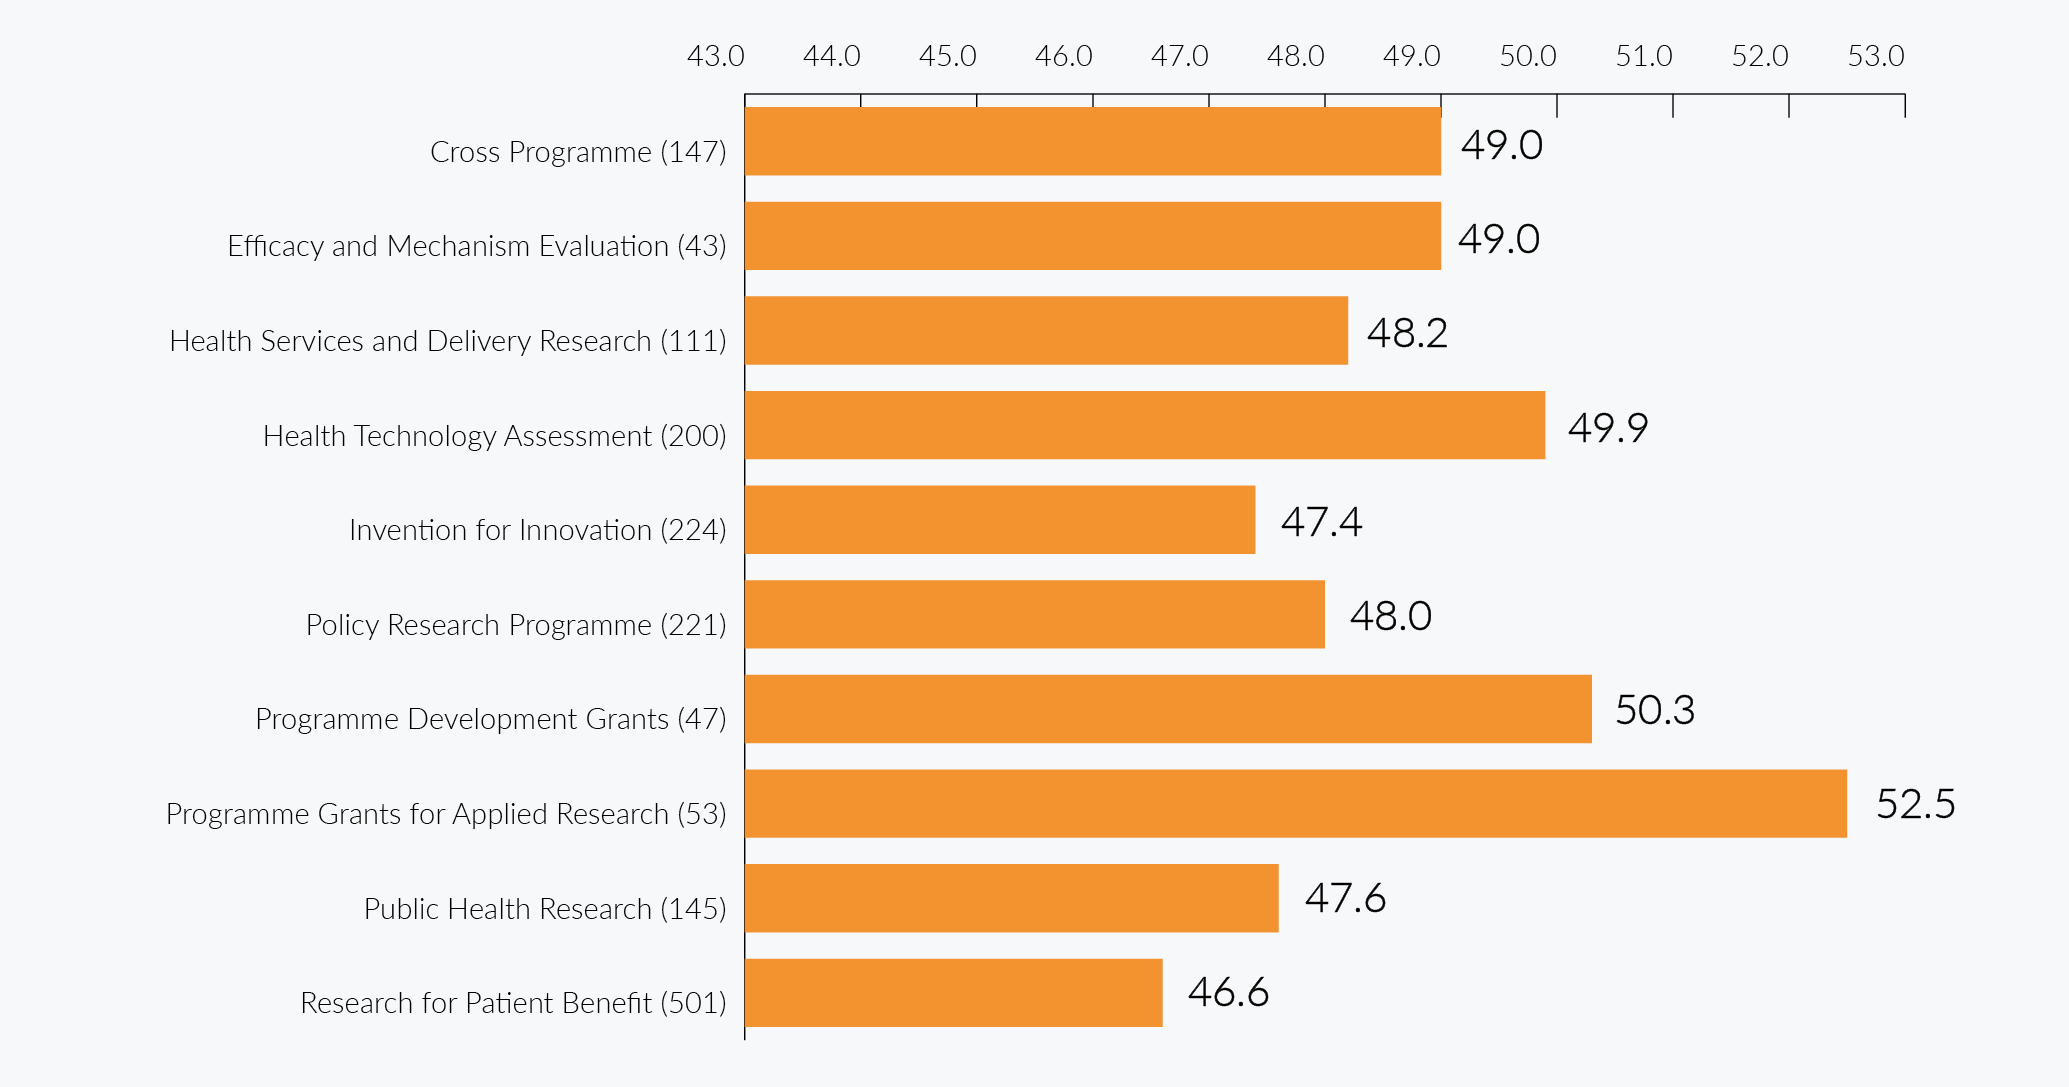
Applications for funding – average age
The average ages of the lead applicant for NIHR research programmes with at least ten respondents range from 46.6 years to 52.5 years. It was not possible to provide meaningful analysis on the proportions of respondents from each age group for individual research programmes as we did not achieve the minimum for reporting aggregated data.
NIHR Research Programmes Lead Applicants by Average Age (non GHR)
A bar chart outlining average age by research programme types:
Cross Programme 49.0 years from 147 responses.
Efficacy and Mechanism Evaluation 49.0 years from 43 responses.
Health Services and Delivery Research 48.2 years from 111 responses.
Health Technology Assessment 49.9 years from 200 responses.
Invention for Innovation 47.4 years from 224 responses.
Policy Research Programme 48.0 years from 221 responses.
Programme Development Grants 50.3 years from 47 responses.
Programme Grant for Applied Research 52.5 years from 53 responses.
Public Health Research 47.6 years from 145 responses.
Research for Patient Benefit 46.6 years from 501 responses.
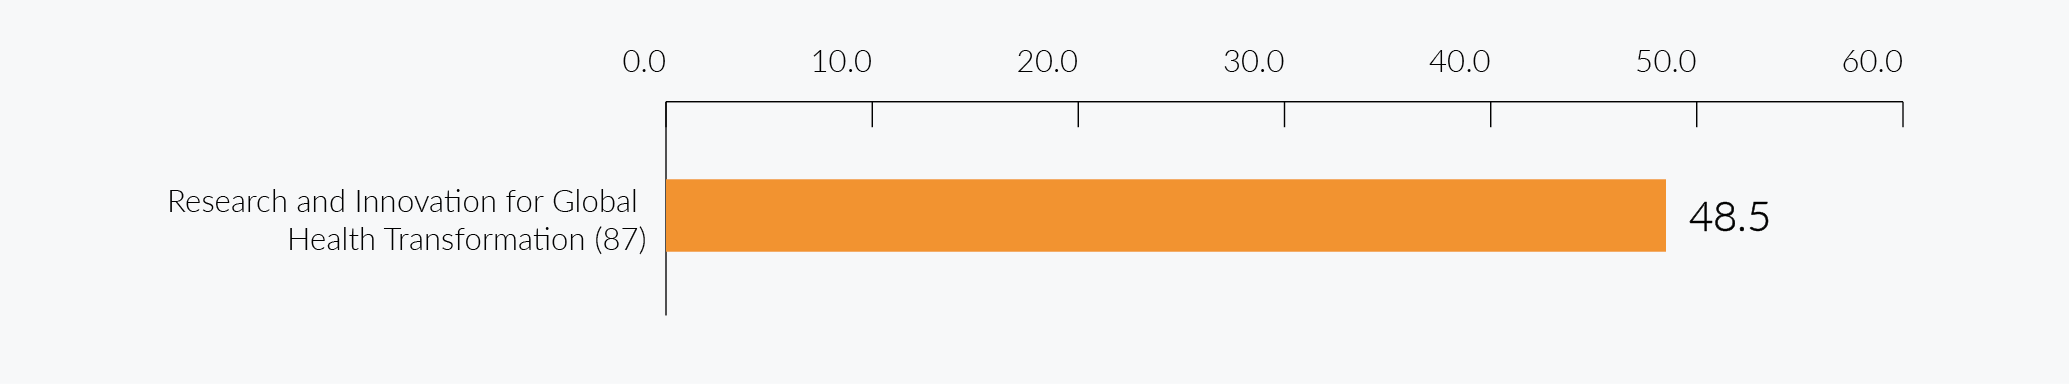
NIHR Research Programmes Lead Applicants by Average Age (GHR)
A bar chart outlining average age by Global Health Research programme types
Research and Innovation for Global Health Transformation 48.5 years from 87 responses.
Applications for funding – actions
In light of the findings of this report, to help increase applications from under-represented groups, we immediately began to investigate improving the quality of our data and the inclusivity and equality of our application process by understanding the barriers researchers face when they apply to the NIHR. Some key highlights:
- Regarding the application process itself, we introduced a special mitigating factors section on our application form for career development awards, giving applicants the option to detail anything they believe the selection committees should account for. This completely optional section replaces the current question around career breaks and will include prompts of possible responses, such as reduced time spent researching due to a disability or caring responsibilities, reduced opportunities to access career support such as mentorship and limited opportunities to undertake prior research and training.
- We have enhanced awareness regarding visual imagery and language for funding calls and promotion. Our fellowship awards application calls now include positive action statements encouraging people from different ethnic backgrounds to apply, accompanied by targeted communications to applicants from underrepresented groups through relevant networks. We are also providing support through webinar series that covers what applicants can expect during the application process, promoting transparency and trust in NIHR’s processes.
- The NIHR has included the ability for an institution to nominate up to three individuals to the Research Professorships programme, open to institutions on the basis that at least one applicant is from an ethnic minority background. This builds on our previous requirement ensuring that at least one applicant is female if more than one nomination is made.
- We launched intervention and recruitment campaigns across all of our programmes to increase applications from underrepresented groups on NIHR programmes.
- We continue to review our processes (positive action statements and accessibility statements) to remove any barrier for researchers applying to us and where necessary introduce new policies and interventions, and to build on the progress we have made to tackle female underrepresentation and insufficient progress to senior positions.
Application Outcomes
To give us an indication of whether there are any disparities in application outcomes by these characteristics we analysed the data on outcomes that were known for applications received during this reporting period. For 2020/21, we focussed
on analysing by career development and research for sex and ethnicity, and only across all programme types for disability. We understand this can only provide us with a rudimentary benchmark, which we aim to augment considerably in future reporting years.
Due to the limitations of the data, we have not included age and the breakdowns are limited – the data is not robust enough for us to make inferences or draw conclusions. Again, we plan to address this in future by reporting this by programme when we have sufficient data.
In addition, figures must be treated with a degree of caution because application outcome information was only available for 69.6% of responses (58.8% of all applications in scope for 2020/21).
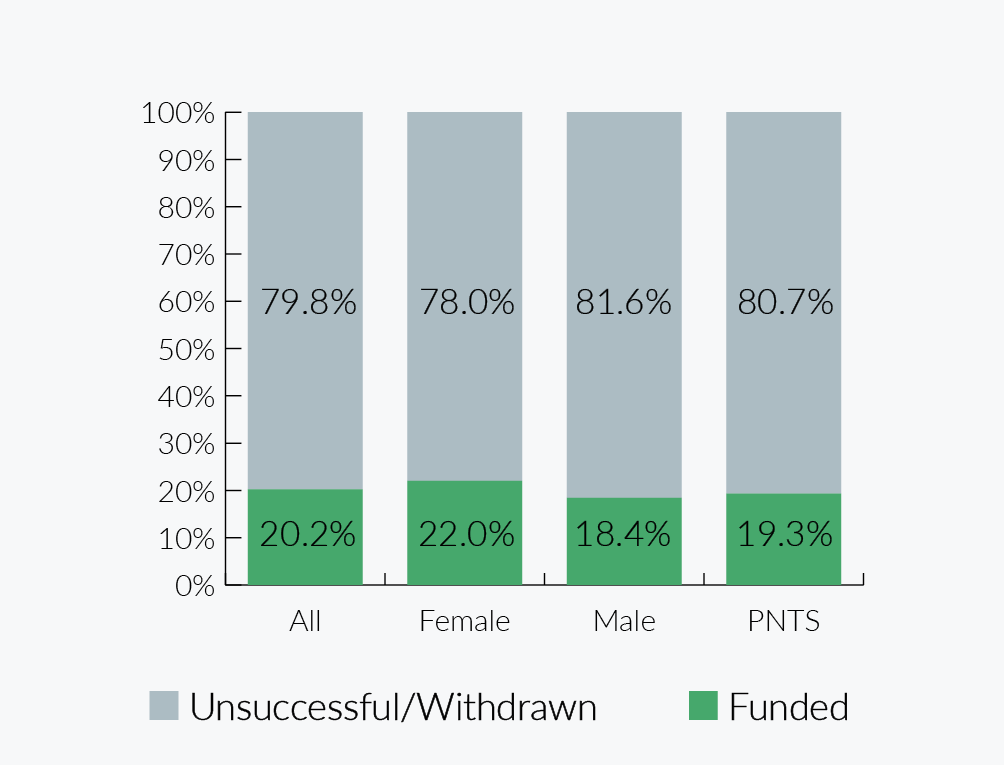
Application outcomes – sex
These charts show application outcomes as a percentage of all applications with a final decision for each sex classification for all NIHR applicants and then for career development and research separately. The ‘award rate’ is the percentage of applications with a final decision that was funded. PNTS responses could not be reported for career development as numbers were below the minimum set for reporting aggregated data.
There was no significant difference in outcomes between females and males for NIHR overall (female 22.0% compared to males 18.4%). This finding was also true for research and career development programmes and when GHR was excluded. Other funders reported similar award rates between sexes. There was insufficient data to report GHR alone or any further breakdowns.
NIHR Application Outcomes by Sex – All Programme Types
A bar chart outlining outcomes by sex all programme types:
All 20.2% funded, 79.8% unsuccessful or withdrawn.
Female 22.0% funded, 78.0% unsuccessful or withdrawn.
Male 18.4% funded, 81.6% unsuccessful or withdrawn.
Prefer not to say 19.3% funded, 80.7% unsuccessful or withdrawn.
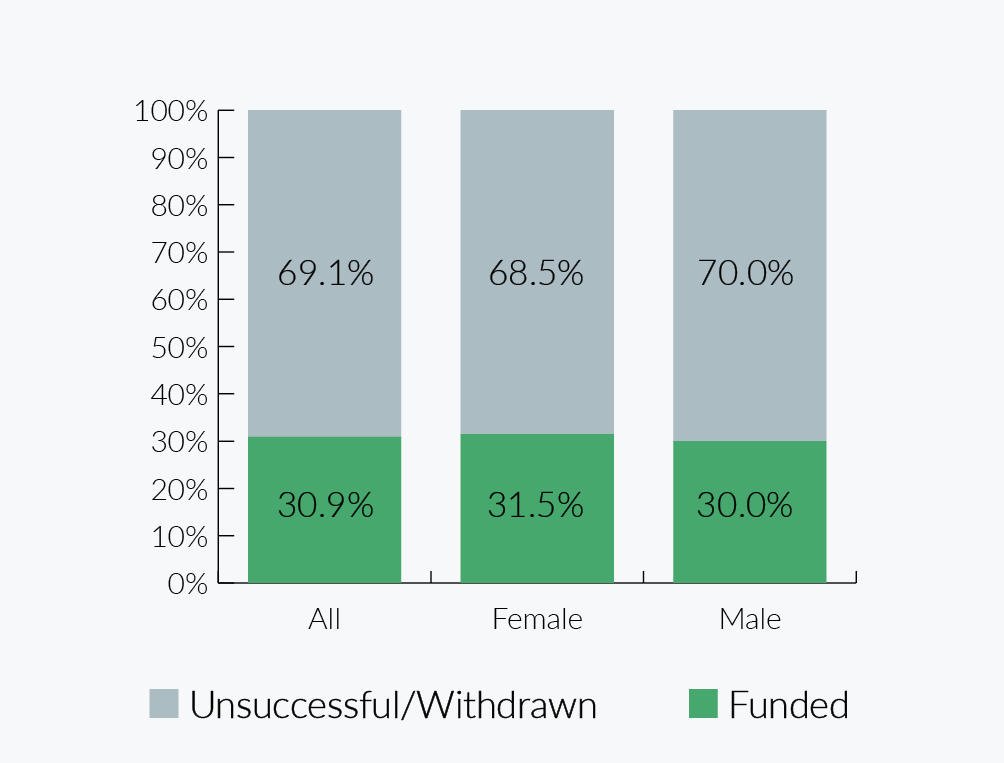
NIHR Application Outcomes by Sex – Career Development
A bar chart outlining outcomes by sex career development programmes:
All 30.9% funded, 69.1% unsuccessful or withdrawn.
Female 31.5% funded, 68.5% unsuccessful or withdrawn.
Male 30.0% funded, 70.0% unsuccessful or withdrawn.
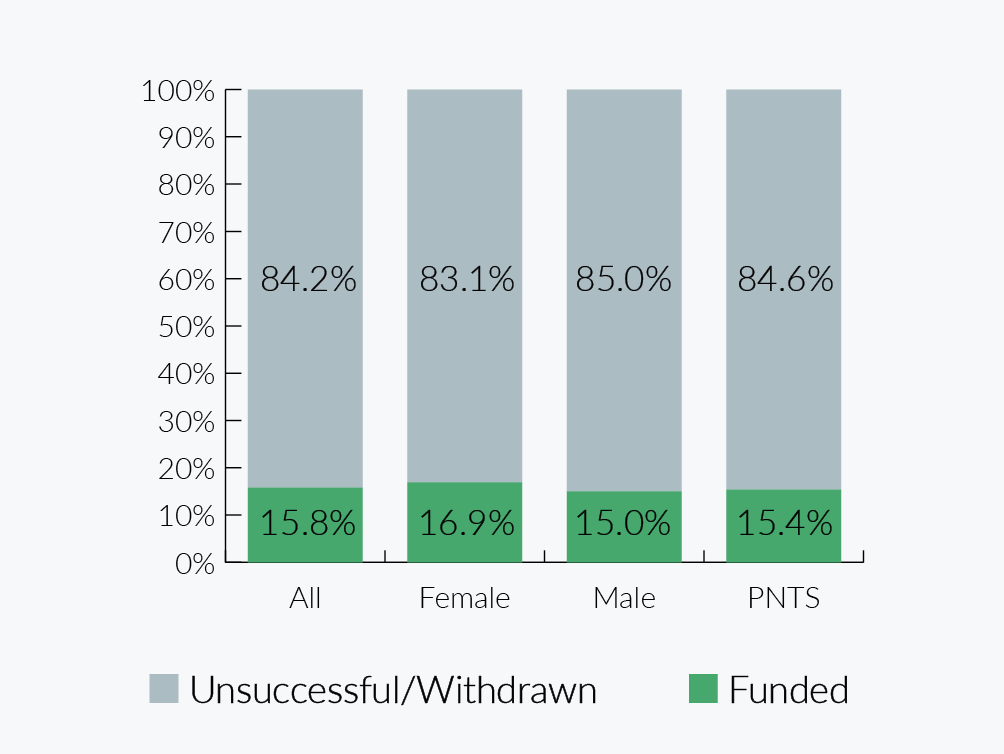
NIHR Application Outcomes by Sex – Research
A bar chart outlining outcomes by sex research programmes:
All 15.8% funded, 84.2% unsuccessful or withdrawn.
Female 16.9% funded, 83.1% unsuccessful or withdrawn.
Male 15.0% funded, 85.0% unsuccessful or withdrawn.
Prefer not to say 15.4% funded, 84.6% unsuccessful or withdrawn.
Application outcomes – ethnicity
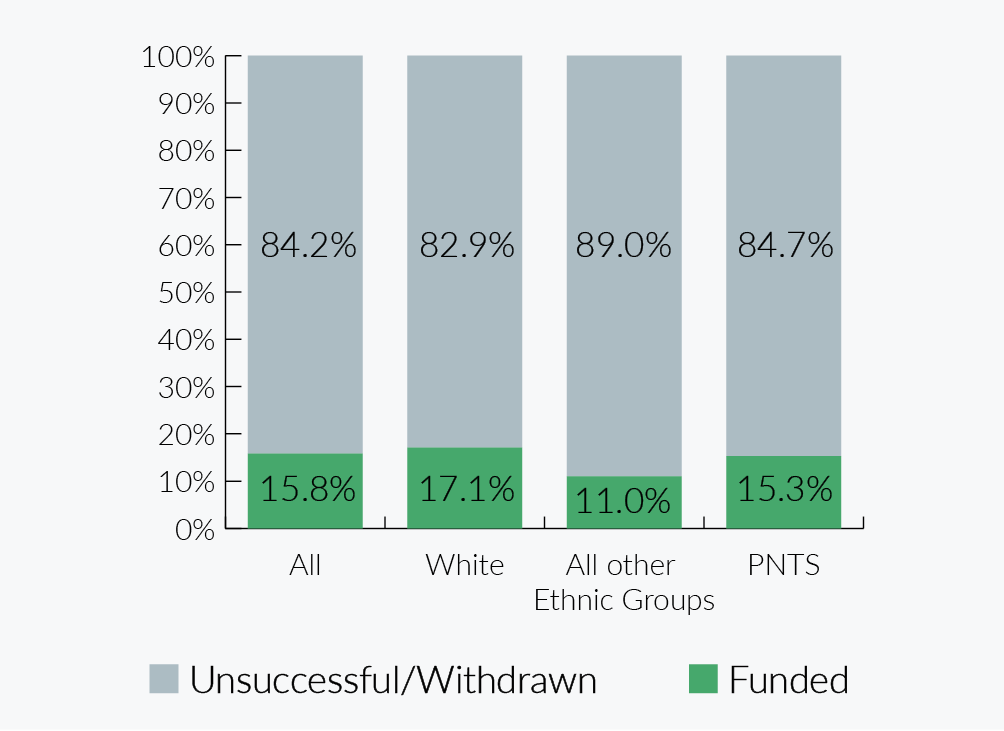
These charts show application outcomes as a percentage of all applications with a final decision for aggregated ethnicity classifications for all NIHR applicants and then for career development and research separately. The ‘award rate’ is the percentage of applications with a final decision that was funded.
Overall fewer applications from all other ethnic groups were funded compared to white applicants (16.5% versus 21.2%). This situation has also been reported by other funders. When research and career development programmes were analysed separately there was also disparity in the funding outcomes for other ethnic groups. This was found to be statistically significant for the research programmes. Further investigation suggests that more applications are falling out of the process at stage 1 or earlier than at the funding board stage for applications from other ethnic groups. Findings were very similar when GHR was excluded from the programmes. The numbers were not sufficient to report GHR on its own.
NIHR Application Outcomes by Ethnicity – All Programme Types
A bar chart outlining outcomes by ethnicity all programme types:
All 20.2% funded, 79.8% unsuccessful or withdrawn.
White 21.2% funded, 78.8% unsuccessful or withdrawn.
All other ethnic groups 16.5% funded, 83.5% unsuccessful or withdrawn.
Prefer not to say 19.2% funded, 80.8% unsuccessful or withdrawn.

NIHR Application Outcomes by Ethnicity – Career Development
A bar chart outlining outcomes by ethnicity career development programmes:
All 30.9% funded, 69.1% unsuccessful or withdrawn.
White 31.8% funded, 68.2% unsuccessful or withdrawn.
All other ethnic groups 28.3% funded, 71.1% unsuccessful or withdrawn.
Prefer not to say 28.6% funded, 71.4% unsuccessful or withdrawn.

NIHR Application Outcomes by Ethnicity – Research
A bar chart outlining outcomes by ethnicity research programmes:
All 15.8% funded, 84.2% unsuccessful or withdrawn.
White 17.1% funded, 82.9% unsuccessful or withdrawn.
All other ethnic groups 11.0% funded, 89.0% unsuccessful or withdrawn.
Prefer not to say 15.3% funded, 84.7% unsuccessful or withdrawn.
Application outcomes – disability
These show application outcomes as a percentage of all applications with a final decision for each disability classification for all NIHR applicants and then for career development and research separately. The ‘award rate’ is the percentage of applications with a final decision that was funded.
There is no significant difference in outcomes between those with a disability and those without. These findings are similar for research and career development when broken down and there is no difference when GHR is excluded.
The numbers were not sufficient to report GHR on its own or to provide any further breakdown.
NIHR Application Outcomes by Disability – All Programme Types
A bar chart outlining outcomes by disability all programme types:
All 20.2% funded, 79.8% unsuccessful or withdrawn.
No disability 20.1% funded, 79.9% unsuccessful or withdrawn.
Have a disability 19.3% funded, 80.7% unsuccessful or withdrawn.
Prefer not to say 22.6% funded, 77.4% unsuccessful or withdrawn.

Award Holders
This group is identified as those in receipt of NIHR research or career development award funding during 2020/21. Included are all chief investigators, lead applicants and those with equivalent status associated with research or career development awards. Awards are those that held funding at any point in our 2020/21 financial year and could have been awarded any time in the previous five years. Where an individual held more than one active award in the period, the response data was included for each such award.
The percentage of respondents range from 64.0% of all award holders for research programmes to 91.6% of all award holders for career development programmes (for the latter, we received 831 responses from a pool of 907).
Data was provided in aggregated form rather than individually for the following research programmes: Efficacy and Mechanism Evaluation; Health Services and Delivery Research; Health Technology Assessment; and Public Health Research. These are referred to in the programme tables as ‘NETS Programmes’.
In addition, we have not reported GHR numbers separately as only 22 GHR award holders provided a response.
| Programme | Total records in scope | Total EDI responses available | Percentage of records covered |
|---|---|---|---|
| Research Programmes | 1537 | 983 | 64.0% |
| Career Development Programmes | 907 | 831 | 91.6% |
| All Programmes | 2444 | 1814 | 74.2% |
Award holders – sex
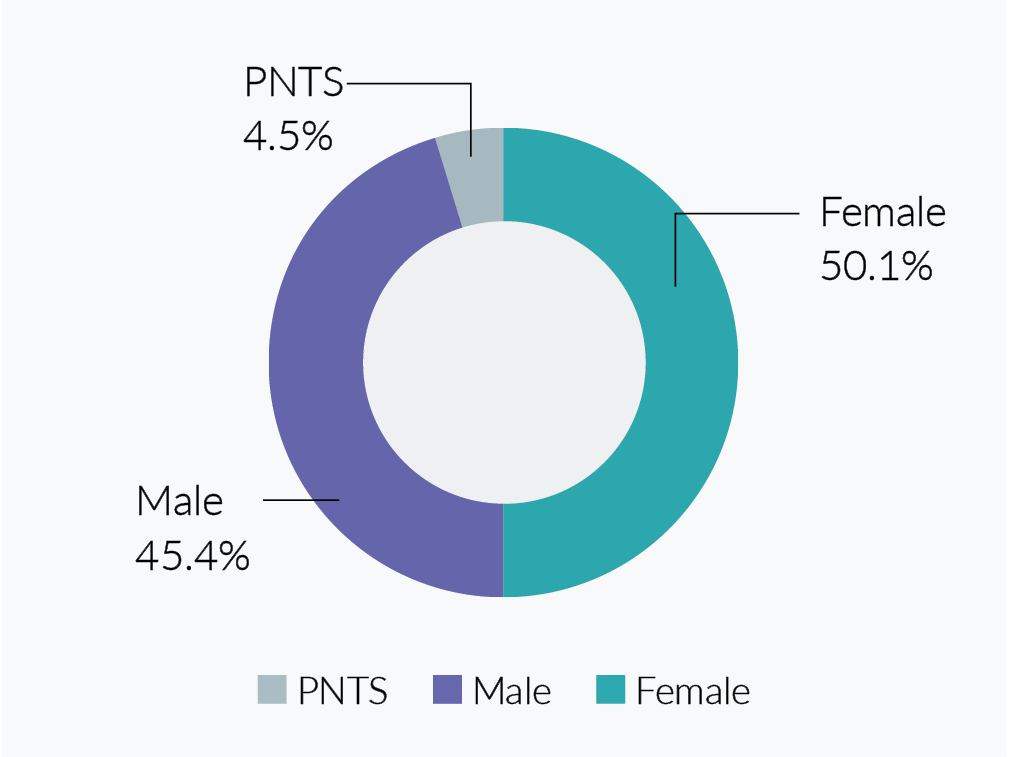
50.1% of all award holders were female and 45.4% were male, a ratio that remains the case when global health data is excluded. The percentage of females for global health award holders is also 50%.
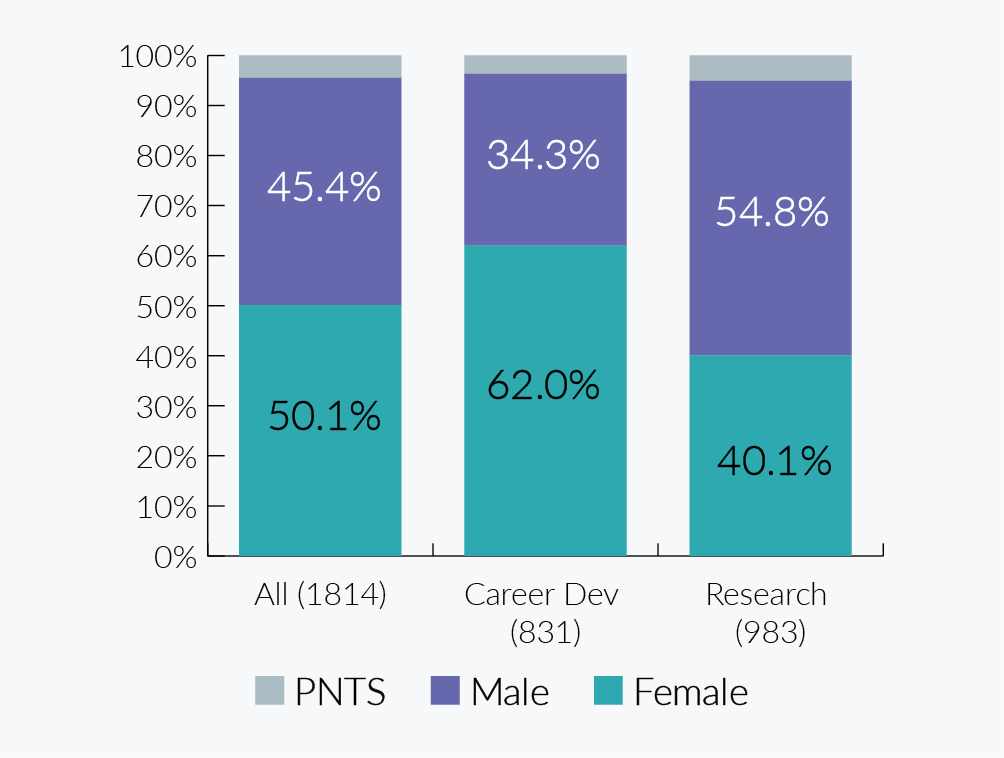
Females make up the majority of award holders for career development programmes (62%) and a minority for research (40.1%), numbers that are almost identical when GHR data is excluded (62.0% versus 39.2%). Both overall and when GHR responses are excluded, the proportion of females for career development is greater than HESA academic staff (52%). In addition, the proportion of females within research award holder responses is considerably lower than for HESA staff (40.1% versus 52.3%). As there were only 4 global health award holder responses for career development, it was not possible to present a meaningful comparison of programme types for this group.
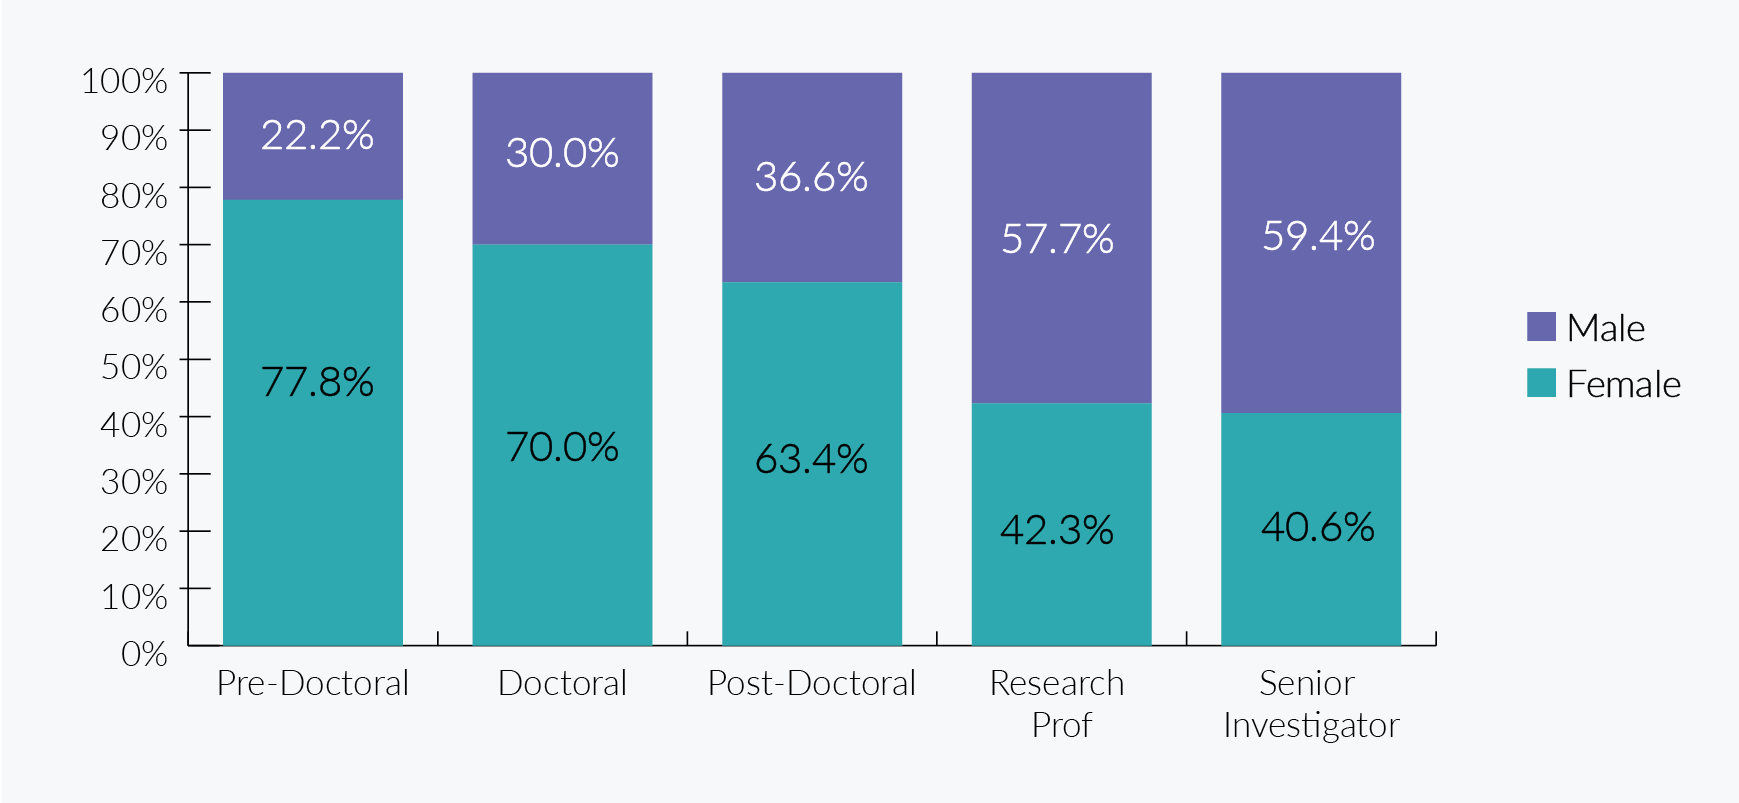
The proportion of female award holders declines as the career stage advances – whether including or excluding GHR data. Our earlier career stage data compares favourably with that reported by HESA for postgraduate students (71.1% female). Note that for this analysis, PNTS responses were excluded as the numbers for this category did not comply with the agreed minimum for reporting aggregated data.
NIHR Award Holders by Sex n = 1814
A pie chart showing 45.4% male, 50.1% female and 4.5% prefer not to say, from a sample of 1814.
NIHR Award Holders by Sex by Programme Type
A bar chart showing:
All award holders 50.1% female 45.4% male from a sample of 1814.
Career development 62.0% female 34.3% male from a sample of 831.
Research 40.1% female 54.8% male from a sample of 983.
NIHR Career Development Award Holders Sex by Career Stage n = 800
A bar chart with a sample size of 800 showing:
Pre-Doctoral 77.8% female and 22.2% male.
Doctoral 70.0% female and 30.0% male.
Post-Doctoral 63.4% female and 36.6% male.
Research Professionals 42.3% female and 57.7% male.
Senior Investigator 40.6% female and 59.4% male.
Award holders – sex by specific programme type
This table shows the percentage split for individual programmes – note that this can only be reported where the number of responses for each category meets the agreed minimum requirements for reporting aggregated data. PNTS responses have been excluded to maximise the number of programmes for which data could be presented. All GHR programmes had at least one category with a value less than 10 therefore we have not reported GHR.
There is considerable variance in the percentages of female award holder respondents. Where data could be reported it ranged in research from 19.8% (Invention for Innovation) to 56.0% (Policy Research Programme), and in career development from 40.6% (Senior Investigator) to 81.0% (HEE/NIHR Integrated Clinical Academic Programme).
NIHR (excluding GHR) Research Programmes – Award Holders by Sex
Research
| Programme | Number of respondents | Female (%) | Male (%) |
|---|---|---|---|
| Invention for Innovation | 102 | 19.6% | 80.4% |
| NETS Programmes (excluding GHR) | 309 | 40.1% | 59.9% |
| Policy Research Programme | 75 | 56.0% | 44.0% |
| Programme Grants for Applied Research | 137 | 43.8% | 56.2% |
| Research for Patient Benefit | 268 | 47.8% | 52.2% |
Career Development
| Programme | Number of respondents | Female (%) | Male (%) |
|---|---|---|---|
| HEE/NIHR Integrated Clinical Academic Programme | 258 | 81.0% | 19.0% |
| NIHR Fellowships | 314 | 65.6% | 34.4% |
| NIHR Integrated Academic Training Programme | 47 | 55.3% | 44.7% |
| Senior Investigator | 143 | 40.6% | 59.4% |
Awards holders – ethnicity
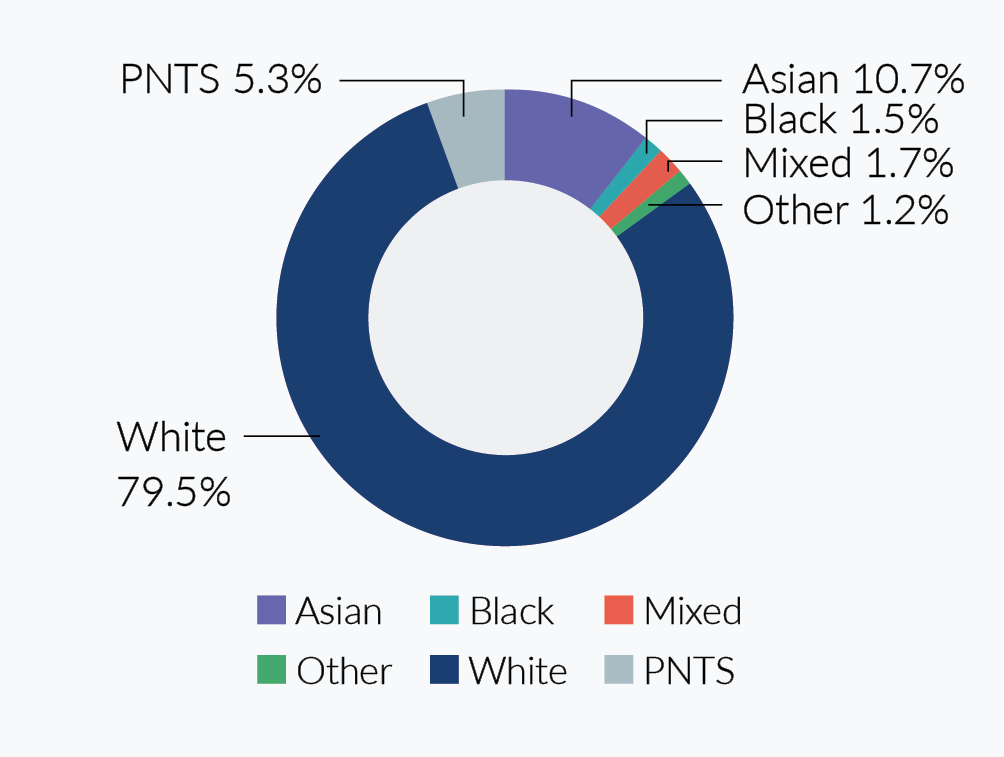
All eighteen possible ethnicity responses were represented in the data. Overall 79.5% of award holders were white and 15.2% were from other ethnic groups combined. These numbers are similar to those reported by HESA (82.2% versus 17.8% with no PNTS). When GHR data is excluded, figures remain similar (79.7% versus 15.0%). We are not able to report on global health as the numbers do not meet the agreed rules for reporting aggregated data.
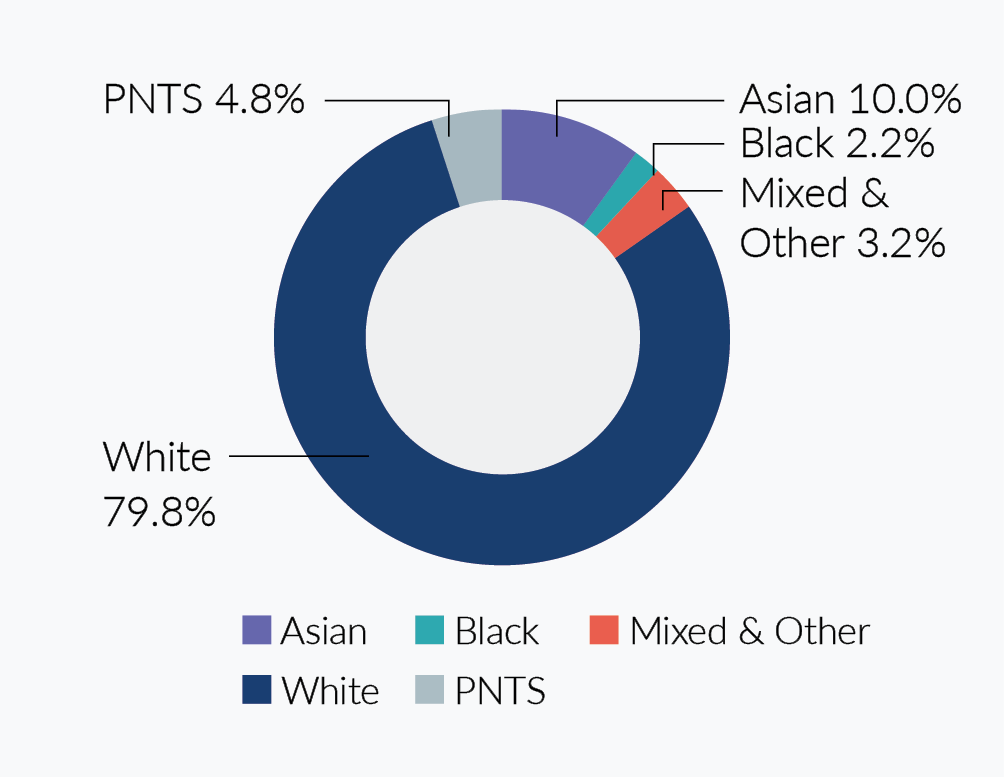
The percentage of all award holders from other ethnic groups is broadly the same for research and career development programmes. Percentages for more detailed ethnicity categories do vary across programme types, however Asian is the second most common ethnicity after White in both cases. We have combined ‘Mixed’ and ‘Other’ in the career development analysis to meet minimum criteria for reporting aggregated data.
NIHR Award Holder Ethnicity – All Programme Types n = 1814
A pie chart with a sample size of 1814 showing 79.5% white, 10.7% Asian, 1.5% black, 1.7% mixed, 1.2% other and 5.3% prefer not to say.
NIHR Award Holder Ethnicity – Career Development n = 831
A pie chart with a sample size of 831 showing 79.8% white, 10.0% Asian, 2.2% black, 3.2% mixed and other and 4.8% prefer not to say.
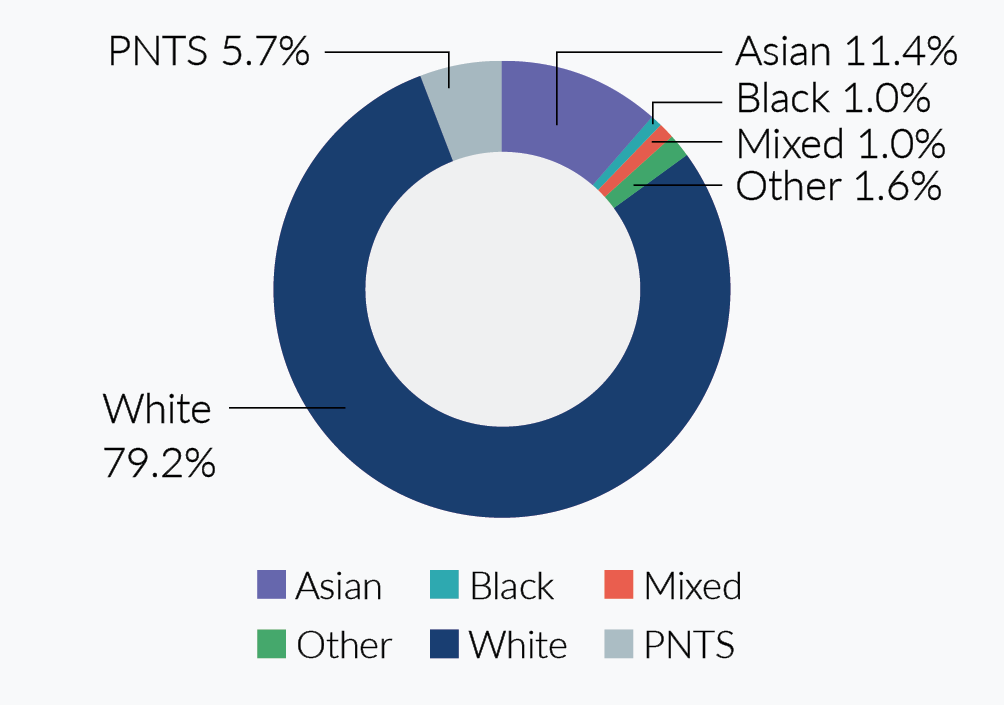
NIHR Award Holder Ethnicity – Research n = 983
A pie chart with a sample size of 983 showing 79.2% white, 11.4% Asian, 1.0% black, 1.0% mixed, 1.6% other and 5.7% prefer not to say.
Awards holders – ethnicity by career stage
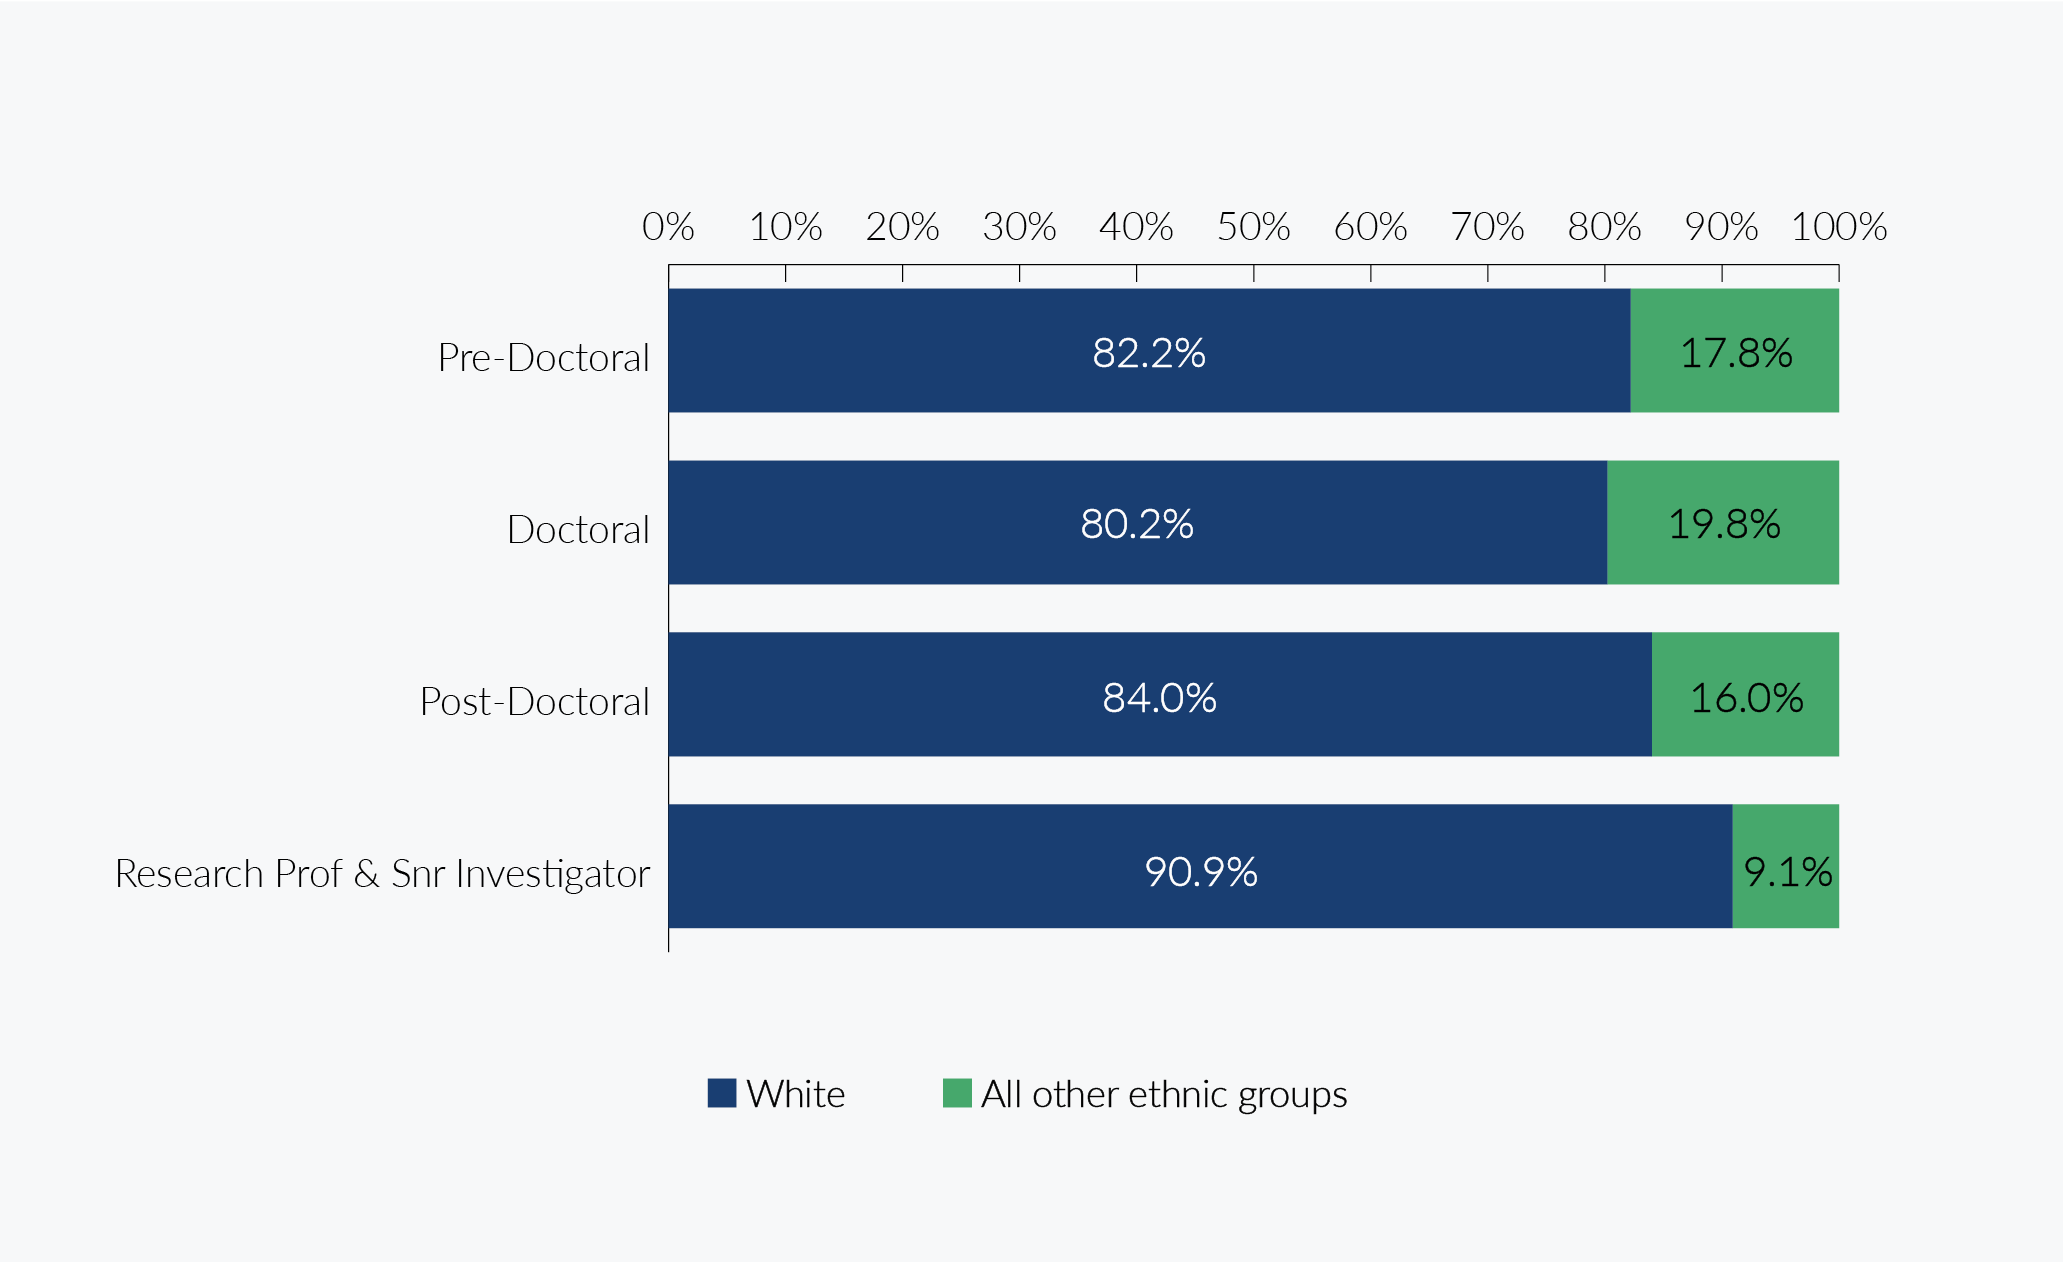
The proportion of Career Development Award from other ethnic groups does vary across the four segments but no definite patterns are identifiable, other than the ratio of all other ethnic groups to white with Research Professors and Senior Investigators is notably lower. This is also the case when GHR data is excluded. To comply with the agreed minimum for reporting aggregated data, we combined Research Professors and Senior Investigators – as response numbers were low when broken down by career stage – and excluded 56 PNTS responses. There were only 4 career development award holder responses for global health so it was not possible to present this data.
NIHR Career Development Award Holders by Career Stage n = 791
A bar chart with a sample size of 791 showing:
Pre-Doctoral 82.2% white and 17.8% all other ethnic groups.
Doctoral 80.2% white and 19.8% all other ethnic groups.
Post-Doctoral 84.0% white and 16.0% all other ethnic groups.
Research Professionals and Senior Investigator 90.9% white and 9.1% all other ethnic groups.
Awards holders – ethnicity by programme
This data can only be reported when the number of responses for each category met the agreed minimum requirements for reporting aggregated data. PNTS responses were excluded to maximise the number of programmes for which data could be presented.
Across all NIHR programmes with at least 10 respondents, the percentage of respondents from other ethnic groups ranged from 7.2% (Career Development – Senior Investigator) to 28.3% (Career Development – NIHR Integrated Academic Training Programme). When comparing percentages for different programmes, the number of responses should also be considered.
NIHR Award Holders by Career Stage
| Programme Type | Programme | Number of Responses (Excluding PNTS) | White | All Other Ethnic Groups |
|---|---|---|---|---|
| NIHR (excluding GHR) Award Holders Ethnicity by Programme | ||||
| Career Development | HEE/NIHR Integrated Clinical Academic Programme | 256 | 89.1% | 10.9% |
| Career Development | NIHR Fellowships | 313 | 77.0% | 23.0% |
| Career Development | NIHR Integrated Academic Training Programme | 46 | 71.7% | 28.3% |
| Career Development | NIHR Professorships | 22 | * | * |
| Career Development | NIHR Research Methods Programme | 12 | * | * |
| Career Development | Senior Investigator | 138 | 92.8% | 7.2% |
| Research | Health Innovation Challenge Fund | 1 | * | * |
| Research | Invention for Innovation | 101 | 77.2% | 22.8% |
| Research | NETS Programmes (excluding GHR) | 309 | 82.5% | 17.5% |
| Research | Policy Research Programme | 73 | * | * |
| Research | Programme Development Grants | 11 | * | * |
| Research | Programme Grants for Applied Research | 135 | 91.9% | 8.1% |
| Research | Research for Patient Benefit | 268 | 83.6% | 16.4% |
| NIHR (GHR) Award Holders Ethnicity by Programme | ||||
| Career Development | NIHR Professorships (GHR) | 4 | * | * |
| Research | NETS Programmes (GHR)** | 4 | * | * |
| Research | Research and Innovation for Global Health Transformation | 14 | * | * |
* Indicates that the number of responses for one or more categories was less than 10 and so cannot be reported.
** A small number of award holder responses were not assigned to a specific programme and are therefore excluded.
Award holders – disability
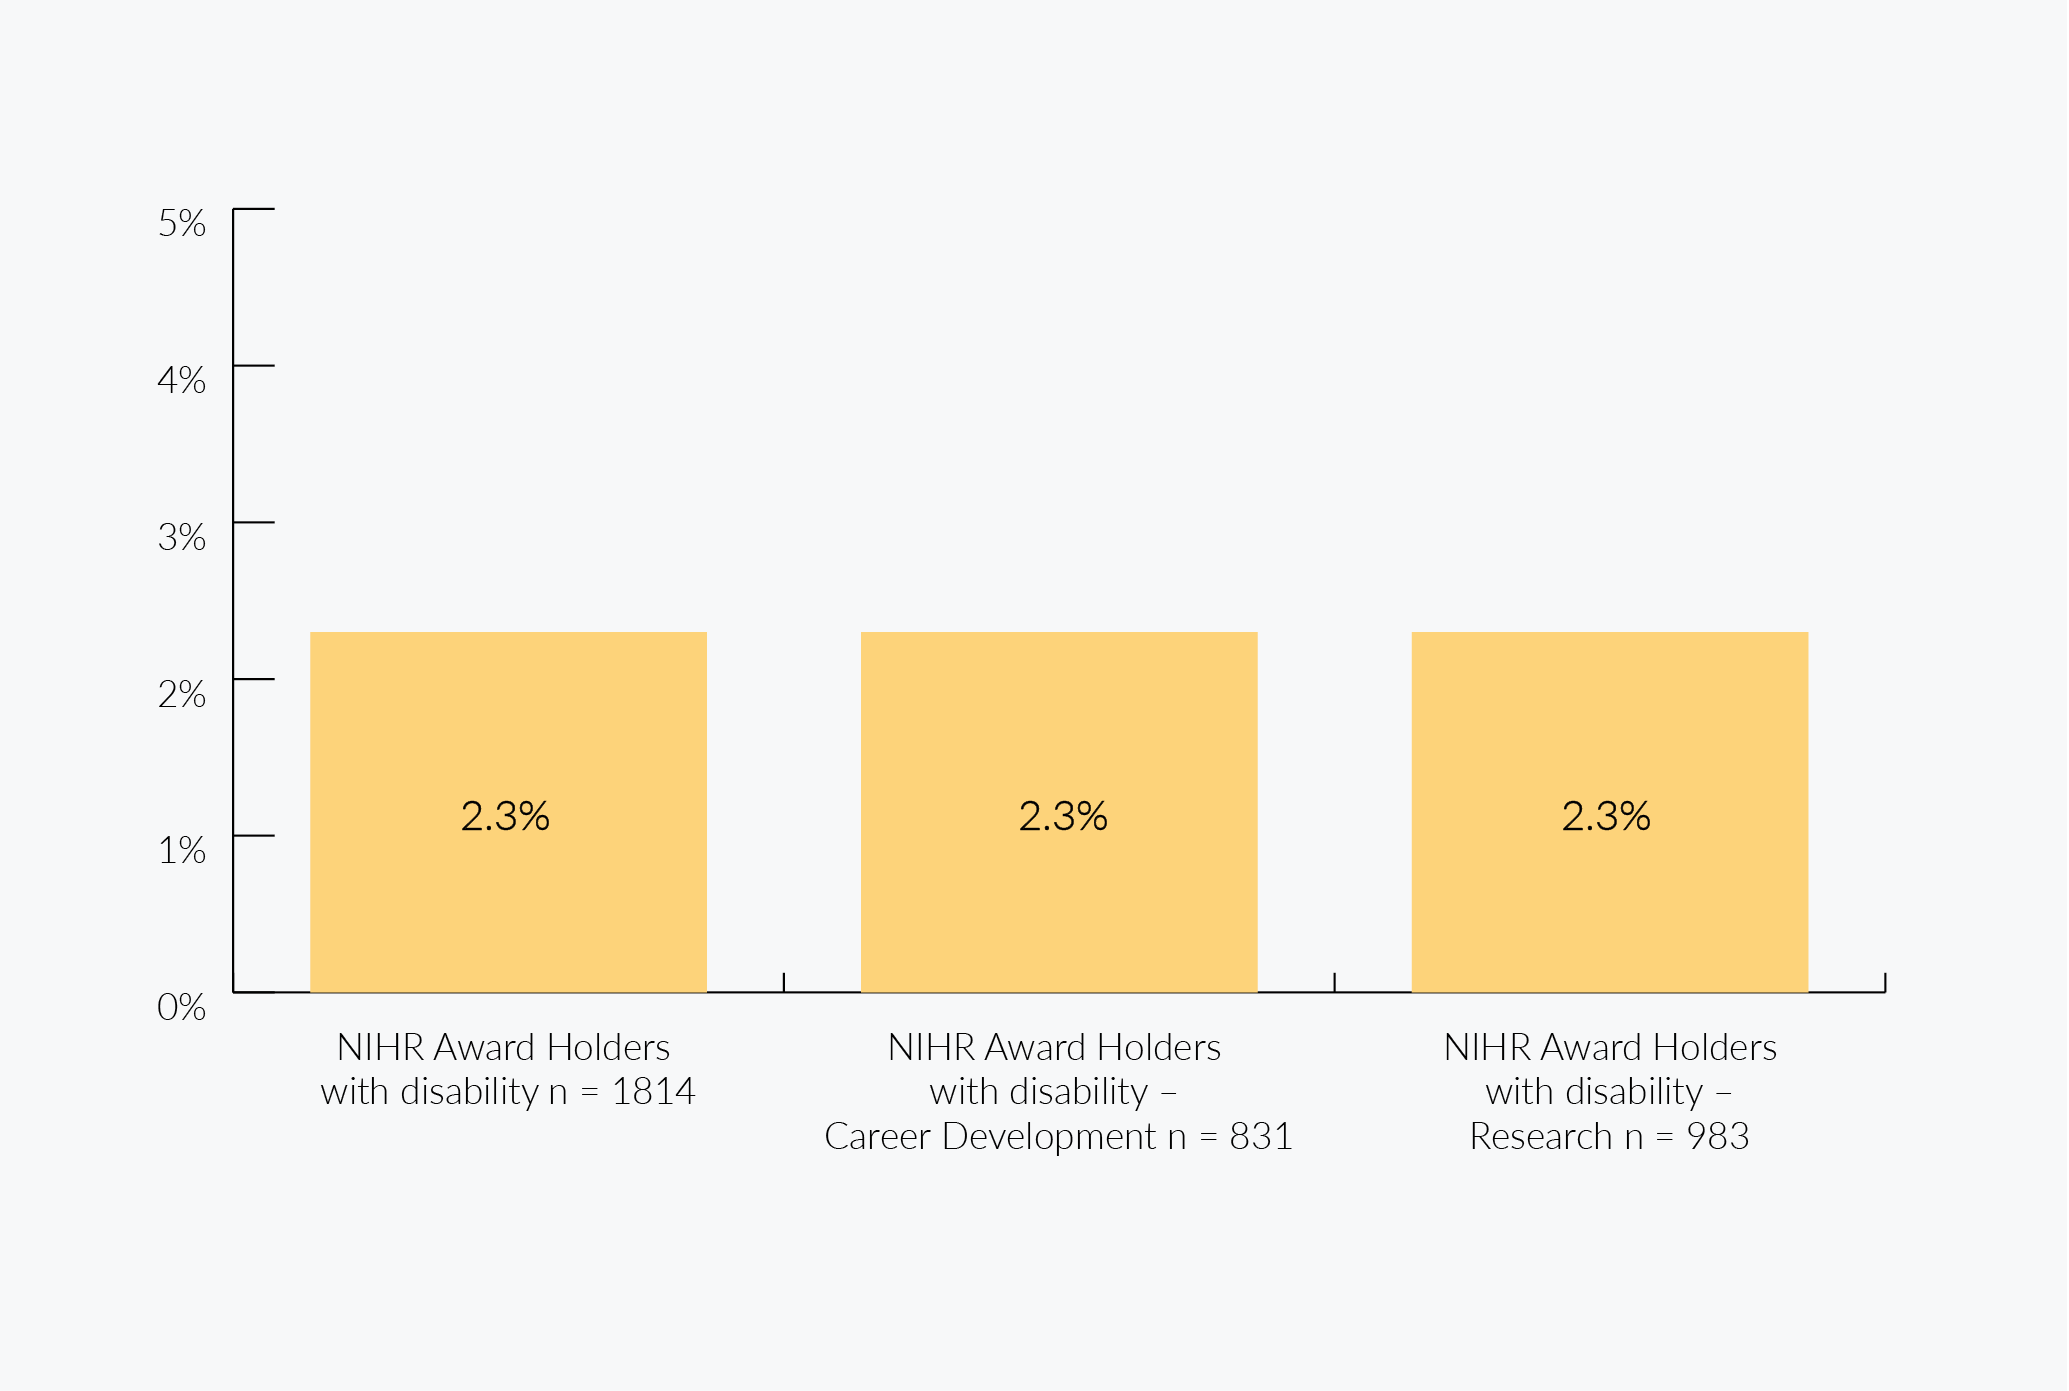
Responders were able to choose from three options: ‘Yes’, ‘No’ and ‘Prefer not to say’. 2.3% of all NIHR award holders had a disability and 91.8% did not. Figures are almost the same once GHR figures are excluded. There were no global health award holders with a disability, however this should be viewed in the context of the low number of responses from this group.
The disability profile for award holders is the same for Research and Career Development programmes as a whole and when GHR data is excluded. With disability, the numbers were too small to show career stages (across programmes, the numbers here ranges from 0% to 4.2%). As there were only 4 global health award holder responses for career development, it was not possible to present this data.
NIHR Award Holders Disability by Programme Type
A bar chart showing:
All award holders with a disability 2.3% from a sample of 1814.
Career development award holders with a disability 2.3% from a sample of 831.
Research award holders with a disability 2.3% from a sample of 983.
Award holders – age
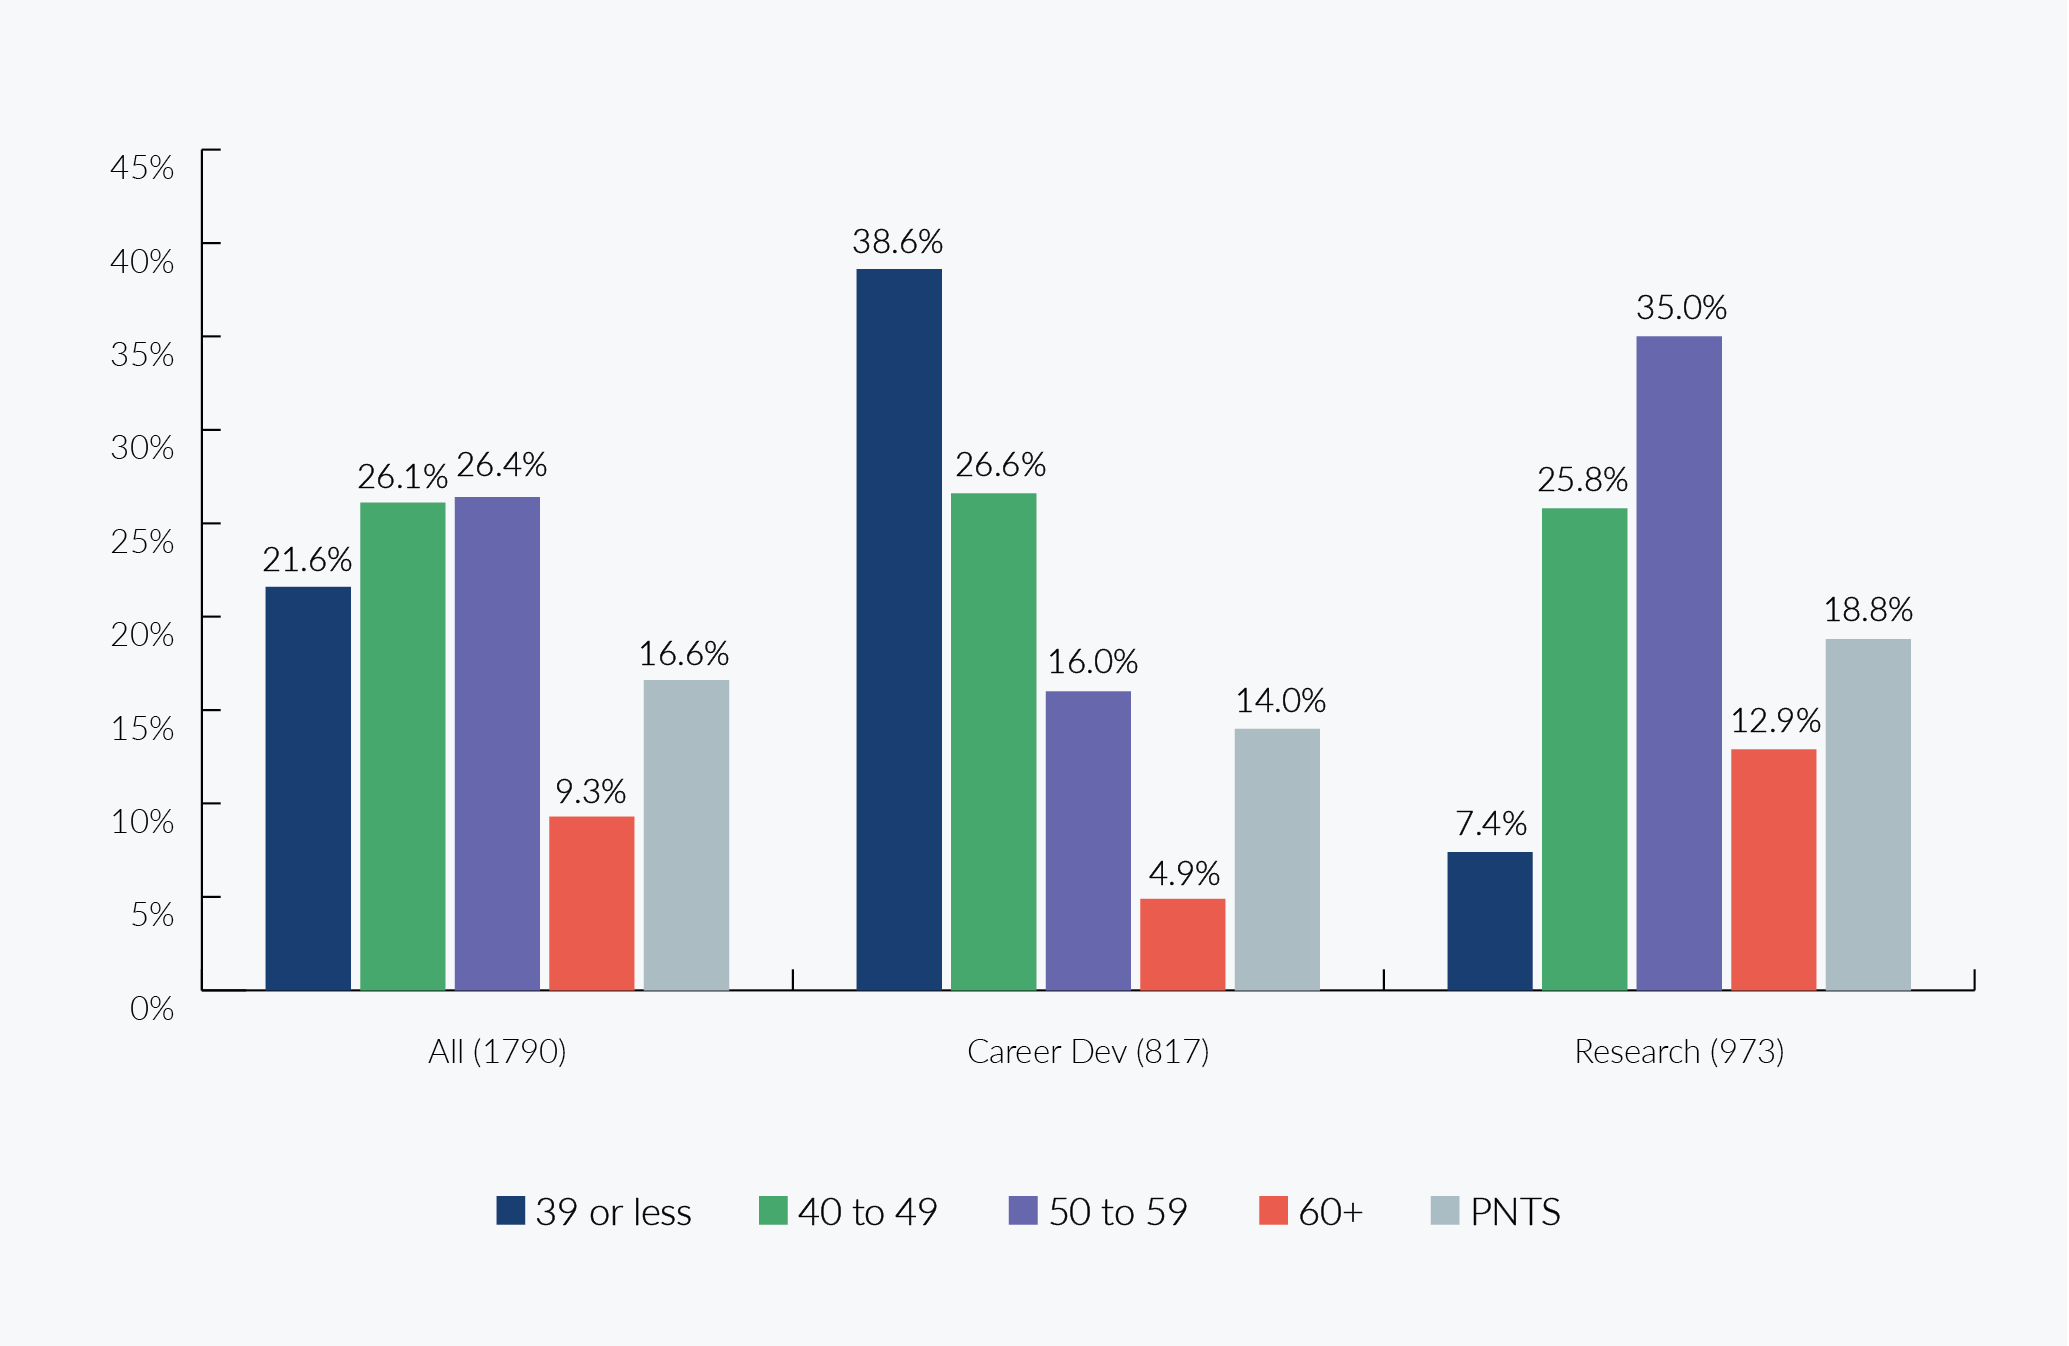
Career development award holders are on the whole younger than their research counterparts, with 65.2% of respondents aged under 50 compared to 33.2%. They are on average 8.7 years younger (42.7 versus 51.4). These differences are magnified in the 39 and under age group. 7.4% of research award holders come from this group, as opposed to 38.6% for career development. The only age grouping with similar ratios is 40-49 years (26.6% for career development versus 25.8% for research).
NIHR Award Holders Age by Programme Type
A bar chart showing award holders by age, all programme types, 21.6% 39 or less, 26.1% 40 to 49, 26.4% 50 to 59, 9.3% 60+, 16.6% prefer not to say, from a sample of 1790.
A bar chart showing career development award holders by age, 38.6% 39 or less, 26.6% 40 to 49, 16.0% 50 to 59, 4.9% 60+, 14.0% prefer not to say, from a sample of 817.
A bar chart showing research award holders by age, 7.4% 39 or less, 25.8% 40 to 49, 35.0% 50 to 59, 12.9% 60+, 18.8% prefer not to say, from a sample of 973.
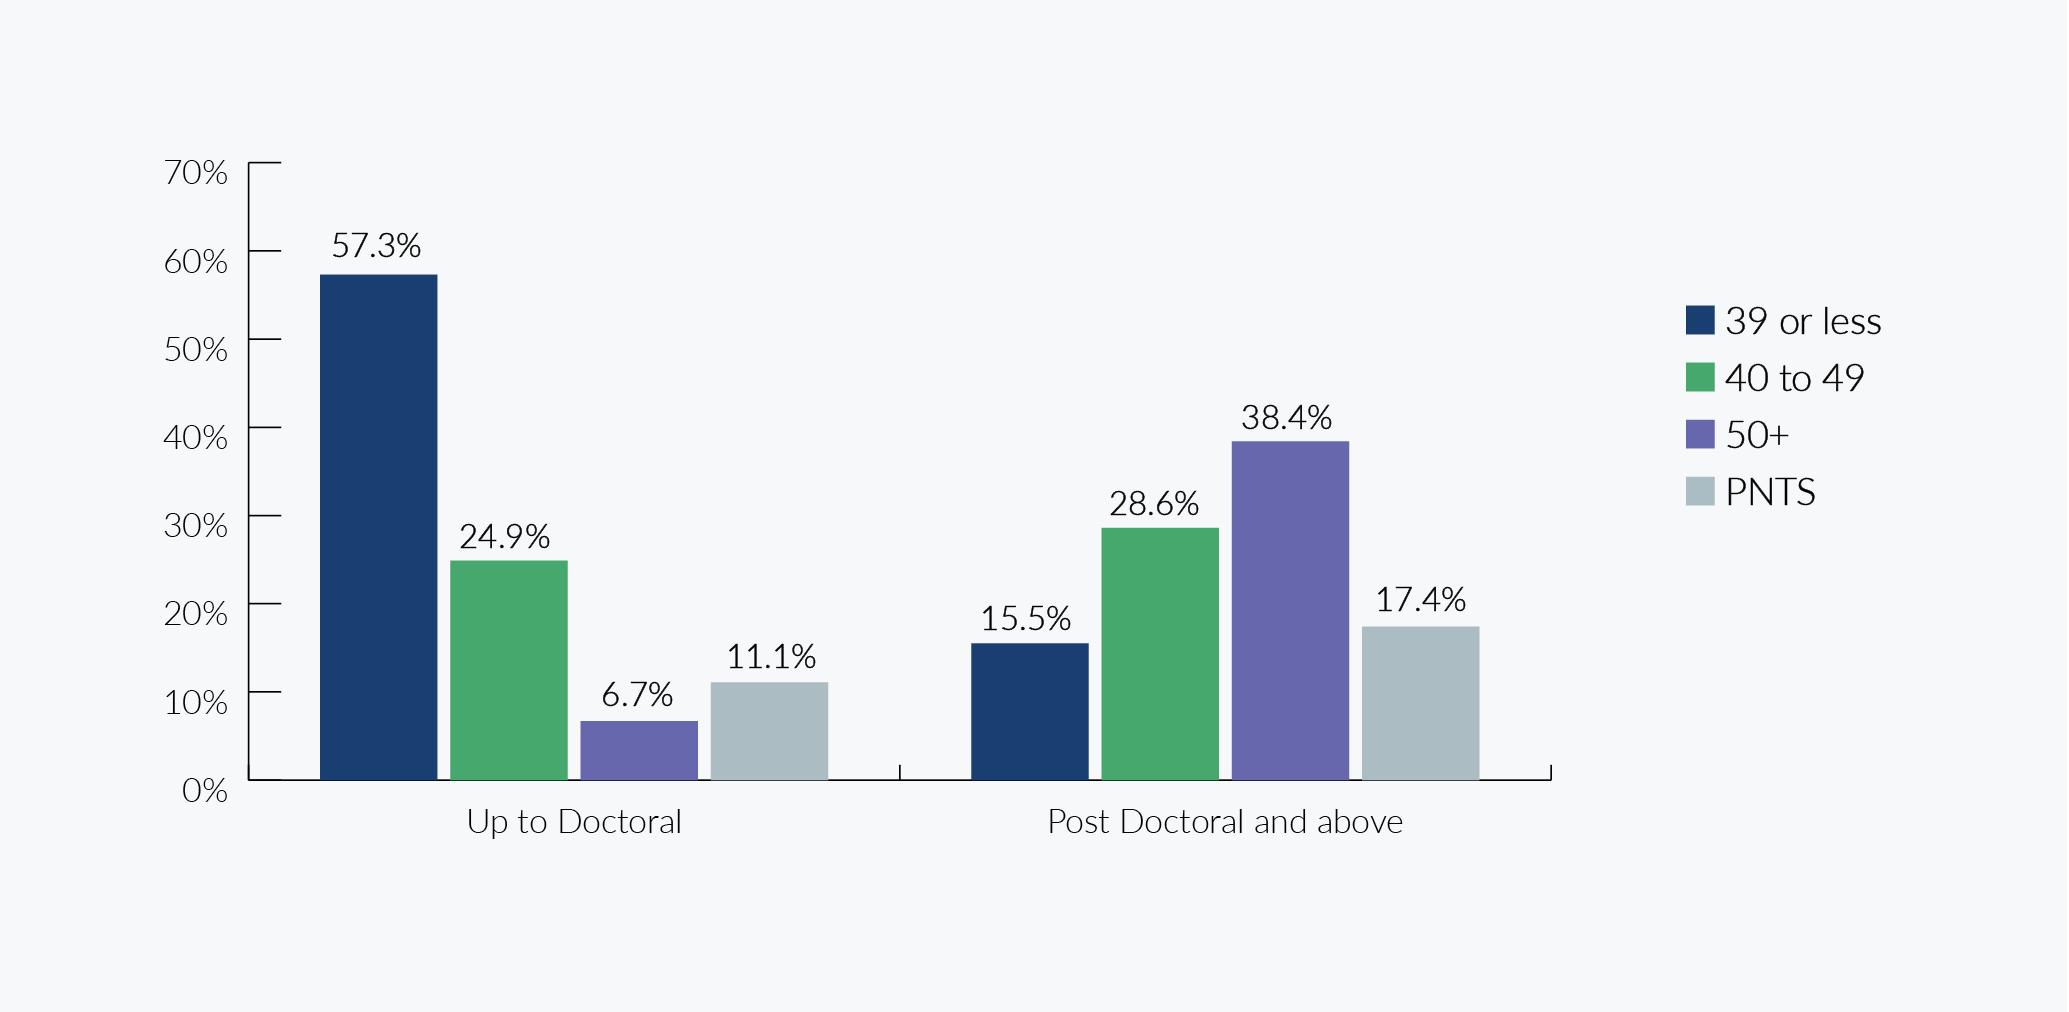
Award holders – age by career stage
As the career stage advances, the age profile gets older, both with all award holders and when GHR award holders are excluded. The majority of Pre- Doctoral award holders are aged under 40 (57.3%) whereas the majority of award holders Post-Doctoral and above are over 40 (67.0%), excluding PNTS. The latter represents a combination of all Post- Doctoral categories, to comply with the agreed minimum for reporting aggregated data, as numbers were low for some categories when broken down by career stage. As there were only 4 career development award holder responses for global health, it was not possible to present this data.
NIHR Award Holders Age by Career Stage n = 817
A bar chart with a sample size of 817 showing:
Up to Doctoral 57.3% 39 or less, 24.9% 40 to 49, 6.7% 50+, 11.1% prefer not to say.
Post-Doctoral and above 15.5% 39 or less, 28.6% 40 to 49, 38.4% 50+, 17.4% prefer not to say.
Award holders – research programmes age
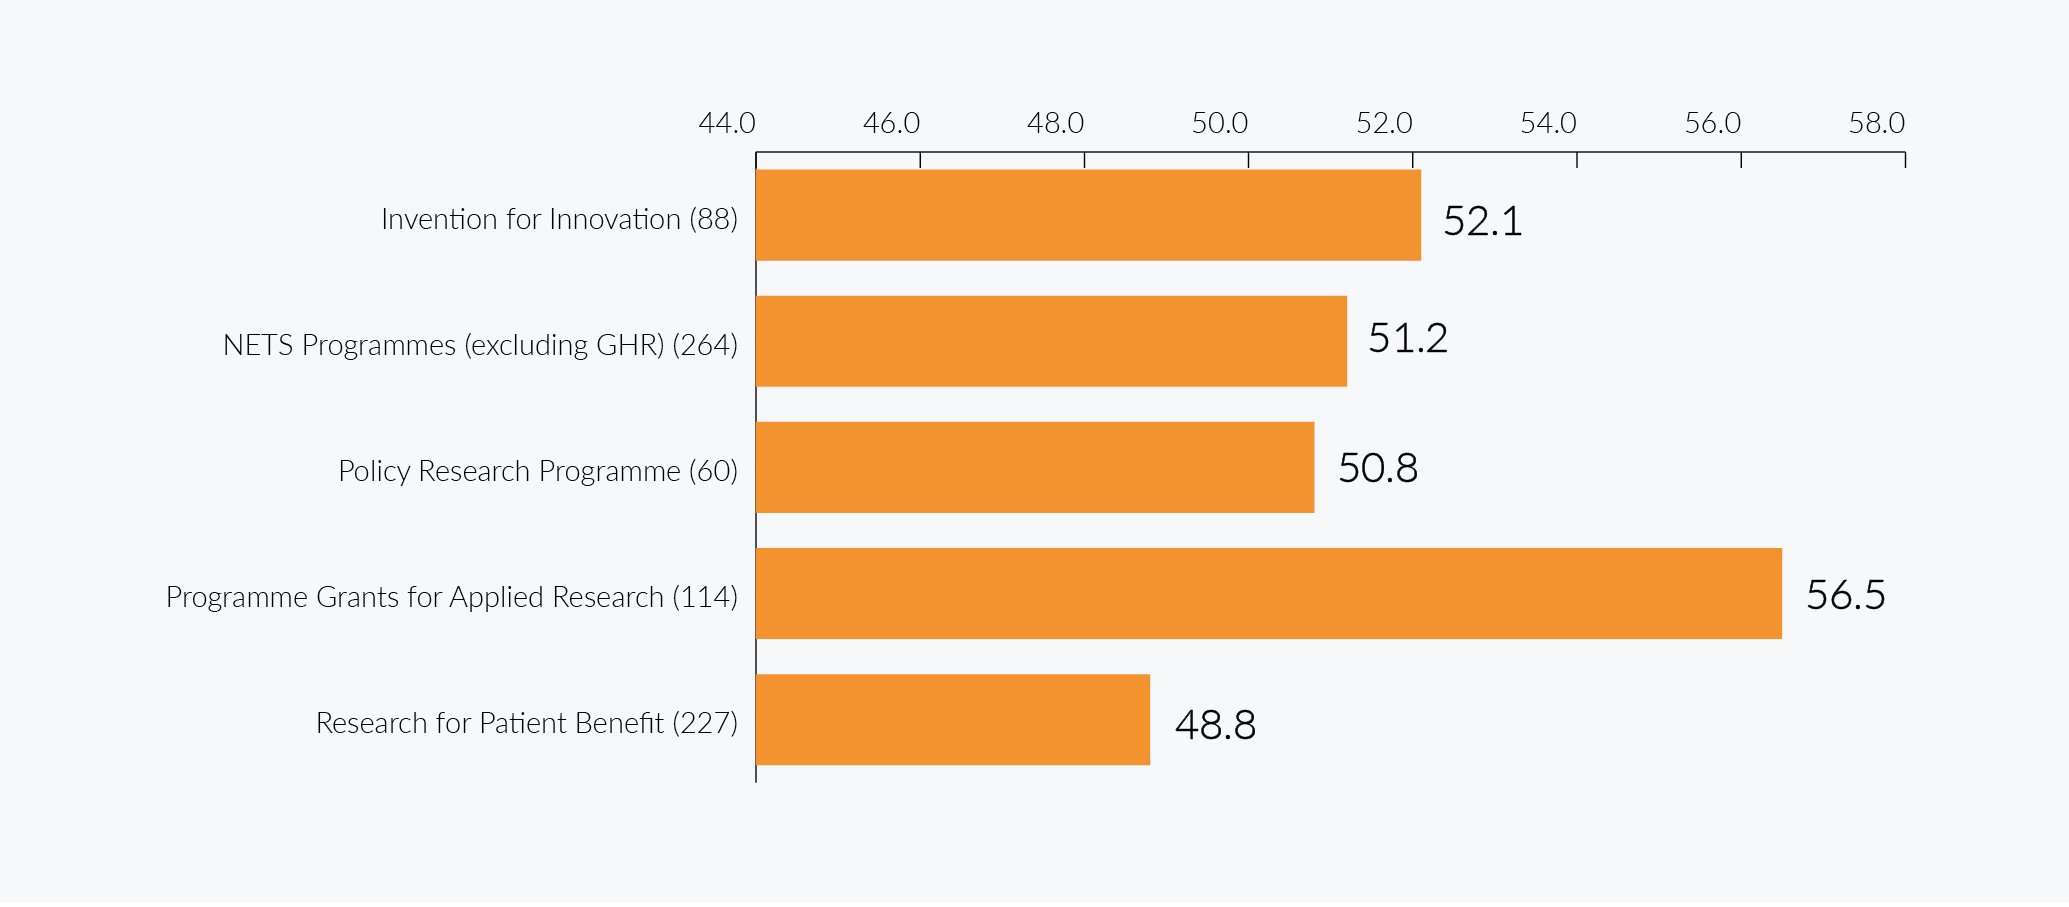
The average ages of award holders in NIHR Research Programmes with at least ten respondents range from 48.8 years to 56.6 years, which is indicative of the career stage of the award holders. It was not possible to provide meaningful analysis on the proportions of respondents from each age group for individual research programmes as we did not achieve the minimum for reporting aggregated data.
NIHR Research Programme Award Holders by Average Age (excluding GHR)
A bar chart outlining average age by research programme types:
Invention for Innovation 52.1 years from 88 responses
NETS Programmes (inlcluding GHR) 51.2 years from 264 responses
Policy Research Programme 50.8 years from 60 responses
Programme Grant for Applied Research 56.5 years from 114 responses
Research for Patient Benefit 48.8 years from 227 responses
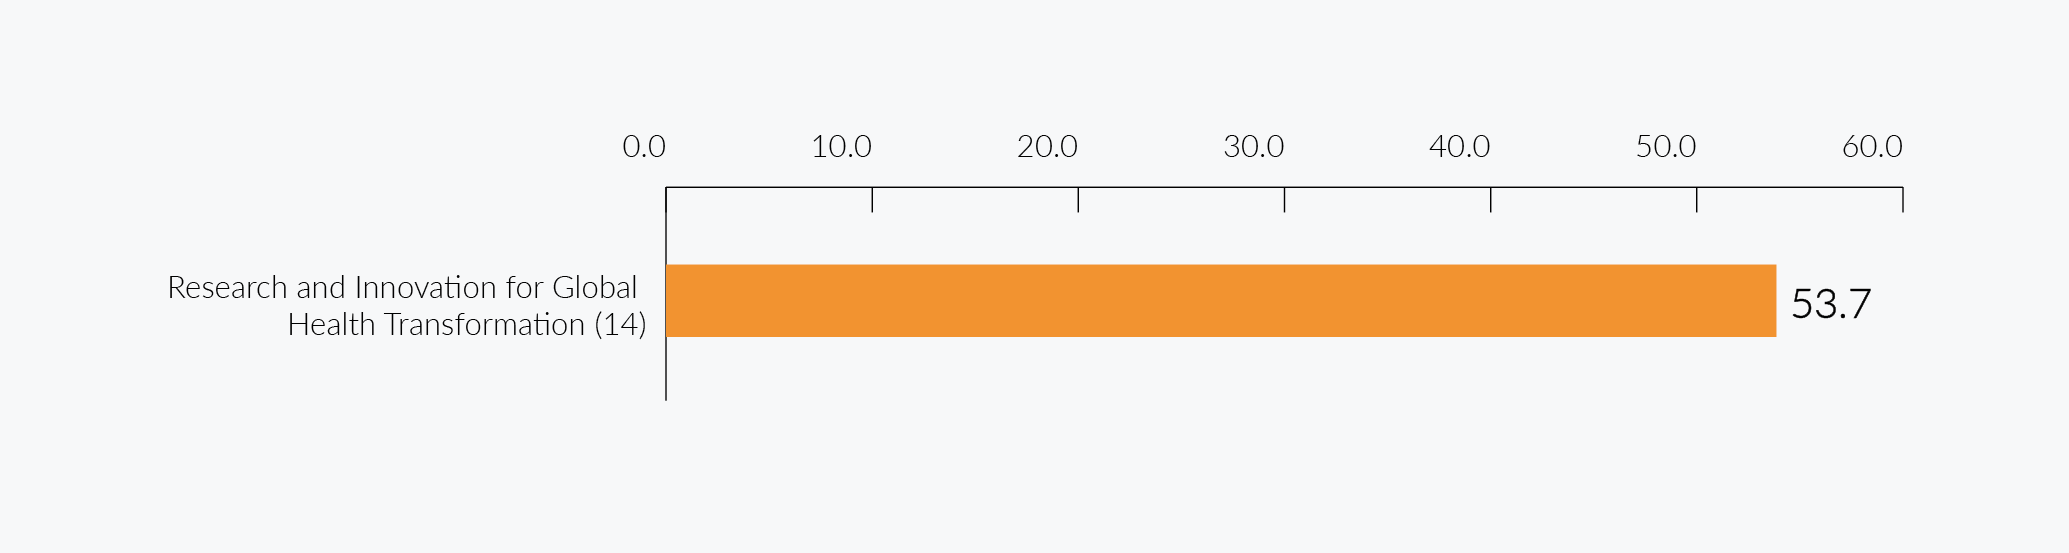
NIHR Global Health Research Programme Award Holders by Average Age
A bar chart outlining average age by Global Health Research programme types:
Research and Innovation for Global Health Transformation 53.7 years from 14 responses.
Selection Committees
This group is defined as people who were serving members of relevant committees in 2020/21. These committees ultimately made decisions on what research would be commissioned and prioritised and determined which applications would be shortlisted, recommended for funding or rejected. In the instances where programmes did not have standing committee members, the data was based on the pool of people eligible to attend.
Where an individual was a member of more than one committee in this period, the data was counted for each committee – for example, if they were a member of two committees their response was counted twice in the dataset.
The percentage of respondents range from 86.1% of all members of selection committees for research programmes to 98.8% of all members of selection committees for career development programmes (for the latter, we received 328 responses from a pool of 332).
| Programme | Total records in scope | Total EDI responses available | Percentage of records covered |
|---|---|---|---|
| Research Programmes | 1009 | 869 | 86.1% |
| Career Development Programmes | 332 | 328 | 98.8% |
| All Programmes | 1341 | 1197 | 89.3% |
Selection committee members – sex
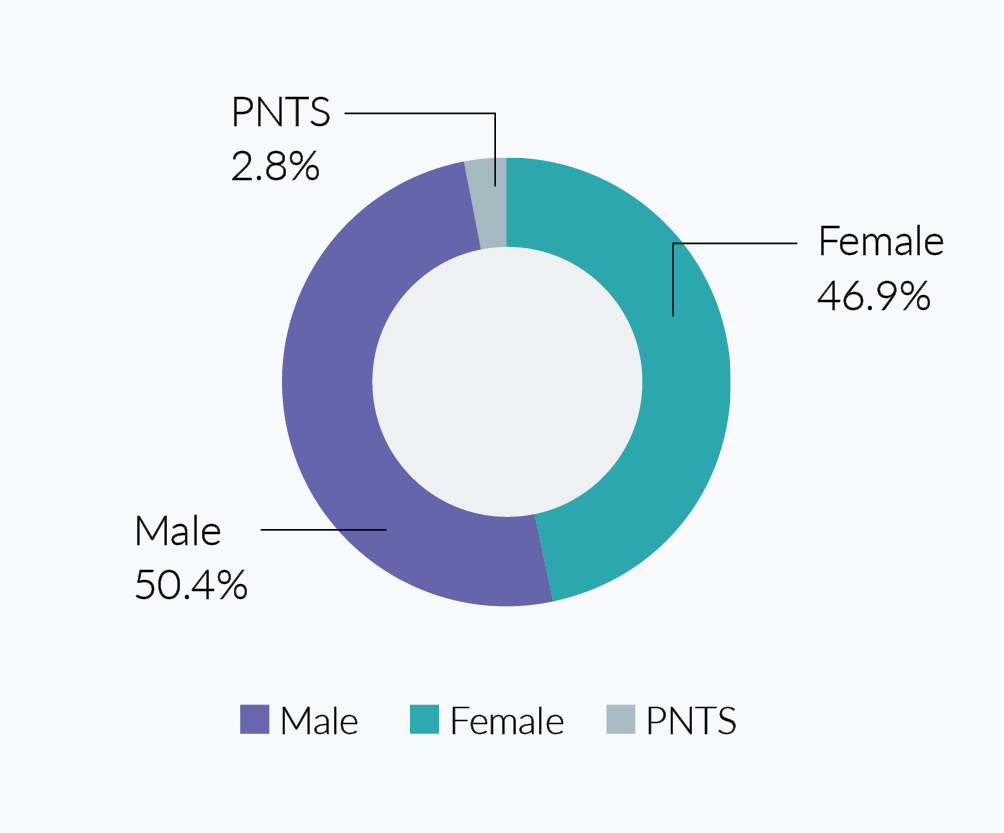
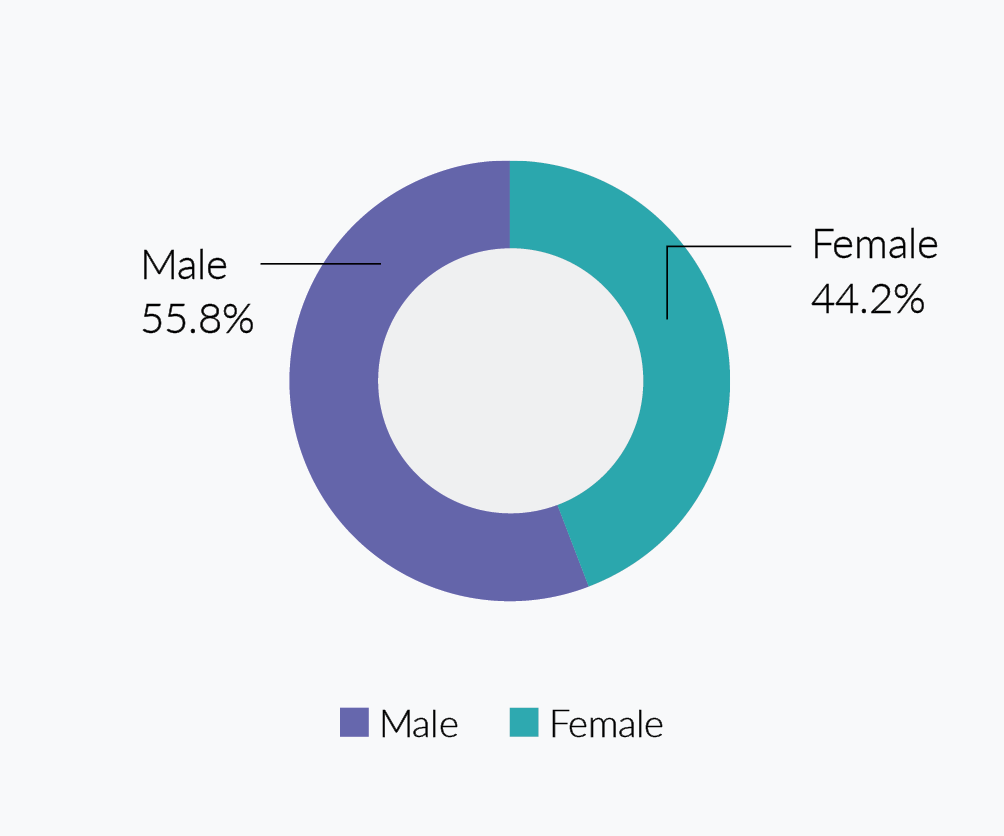
Responders were able to choose from three options: ‘Male’, ‘Female’ and ‘Prefer not to say’. 46.9% of all NIHR committee members in 2020/21 were female and 50.4% were male. Once GHR data was excluded, the split was 47.2% female and 49.7% male. Although both sets of data are close to the sex ratio of the general population, there is still a small skew towards male, although this is intensified with female respondents for global health programme committee members (44.2% versus 55.8%).
NIHR Committee Members by Sex – overall n = 1197
A pie chart showing 50.4% male, 46.9% female and 2.8% prefer not to say, from a sample of 1197.
NIHR Committee Members by Sex – GHR only n = 129
A pie chart showing 55.8% male and 44.2% female, from a sample of 129.
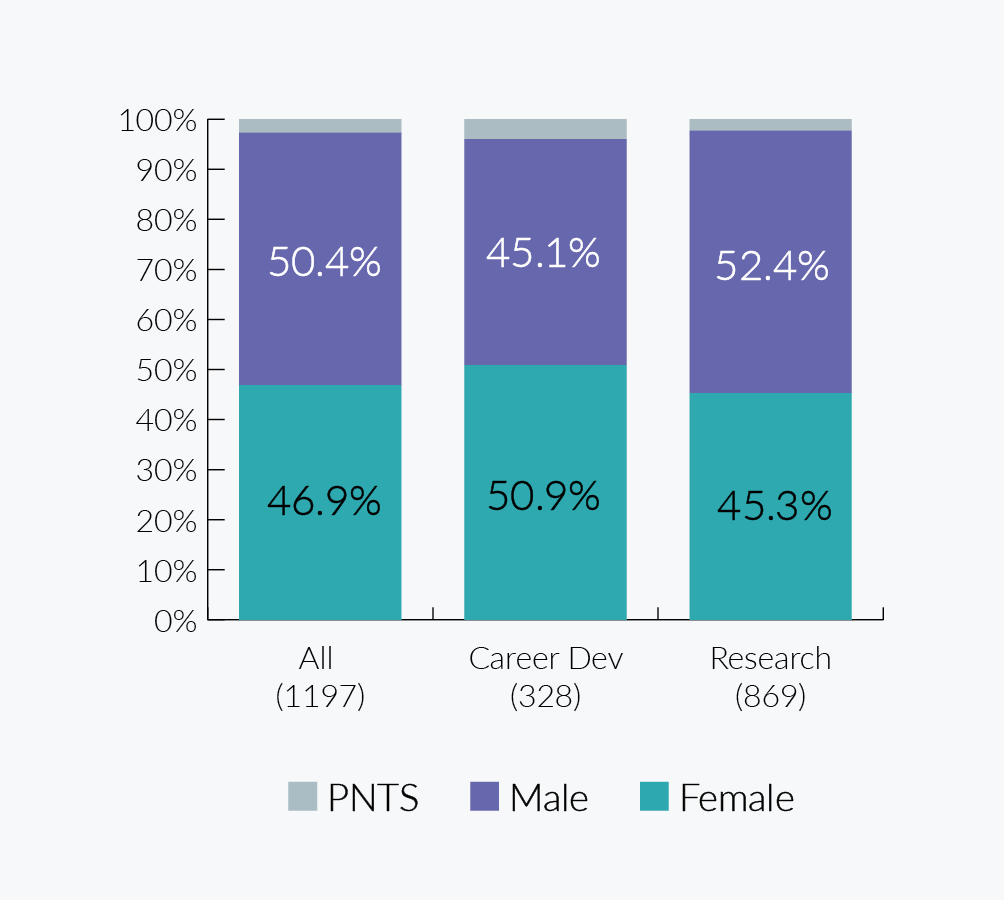
Selection committee members – sex by programme type and role
Overall, career development programmes have higher representation of female committee members. Career development data is comparable with HESA data (52.3% female) and is higher than that reported by other funders, again both overall and when GHR responses are excluded. Research data is a little lower than for HESA staff but is within the range published by other funders. Numbers of global health responses for some categories fall below the agreed minimum for reporting aggregated data when broken down by programme type so data has been rounded in line with convention.
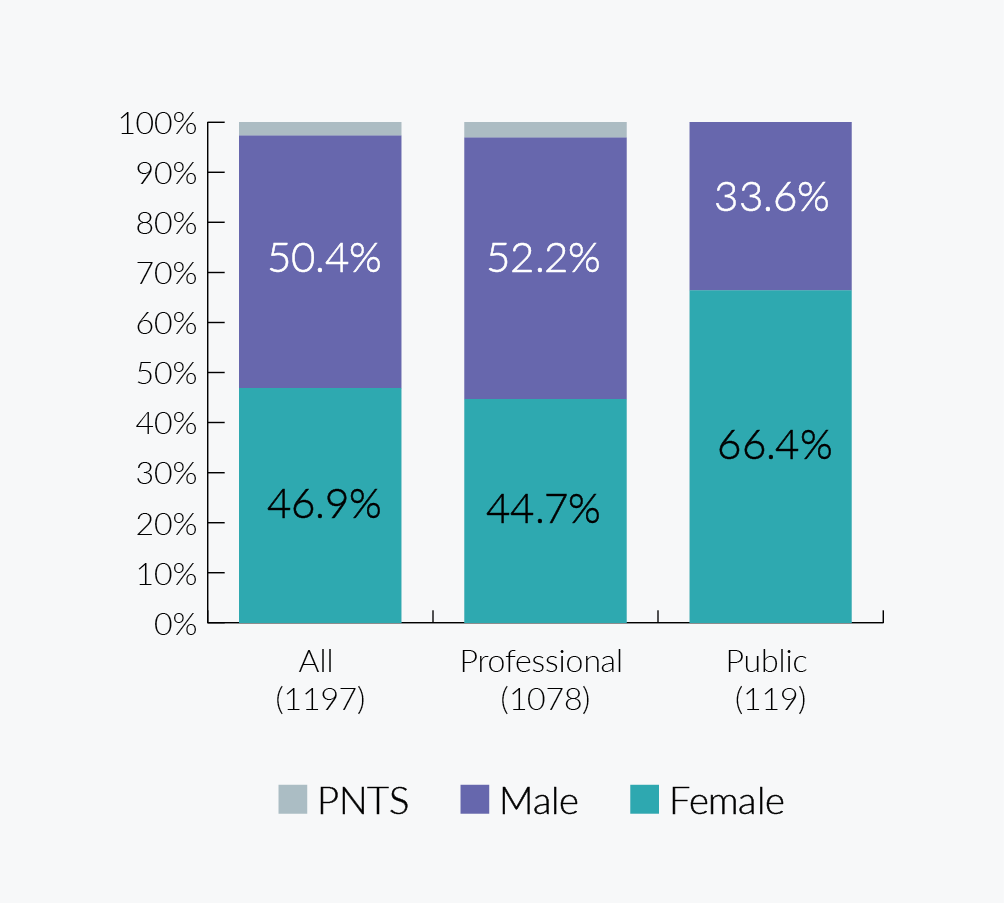
Public members on the committees also have a higher representation of females (66.4% versus 44.7% of professional committee members), numbers which remain similar when GHR data is excluded. The difference in the number of responses for both member types (professional = 1078, public = 119) should be considered as there is a lower number of public members of selection committees overall. As there were only 5 public member responses for global health, it was not possible to present a meaningful comparison by member role for this group.
NIHR Committee Members by Sex by Programme Type
A bar chart showing:
All committee members 46.9% female 50.4% male from a sample of 1197.
Career development 50.9% female 45.1% male from a sample of 328.
Research 45.3% female 52.4% male from a sample of 869.
NIHR Committee Members by Sex by Programme Role
A bar chart showing:
All committee members 46.9% female 50.4% male from a sample of 1197.
Professional 44.7% female 52.2% male from a sample of 1078.
Research 66.4% female and 33.6% male from a sample of 119.
Selection committee members – sex by programme
The representation of the different sexes varies significantly across the different selection committees. Some programmes target specific professional groups, for example ICA and therefore will reflect the representation within this community. The numbers with programmes where data could be reported range from 28.6% female (Research – Artificial Intelligence) to 72.1% female (Career Development – HEE/NIHR Integrated Clinical Academic Programme).
Data can only be reported where the number of responses for each category meets the agreed minimum requirements for reported aggregated data. PNTS responses have been excluded to maximise the number of programmes for which data could be presented. When comparing percentages for different programmes, the number of responses should also be considered.
NIHR Committee Members by Sex by Programme
| Programme Type | Programme | Number of Responses (Excluding PNTS) | Female (%) | Male (%) |
|---|---|---|---|---|
| NIHR (excluding GHR) Committee Members Sex by Programme | ||||
| Career Development | Academic Career Development in NIHR Infrastructure and NIHR Schools (excluding GHR) | 8 | * | * |
| Career Development | HEE/NIHR Integrated Clinical Academic (ICA) Programme | 86 | 72.1% | 27.9% |
| Career Development | NIHR Fellowships | 142 | 46.5% | 53.5% |
| Career Development | NIHR Integrated Academic Training Programme | 8 | * | * |
| Career Development | NIHR Research Professorships | 15 | * | * |
| Career Development | Senior Investigator | 33 | 45.5% | 54.5% |
| Research | Artificial Intelligence | 56 | 28.6% | 71.4% |
| Research | Cross Programme | 24 | 58.3% | 41.7% |
| Research | Efficacy and Mechanism Evaluation | 29 | * | * |
| Research | Evidence Synthesis Programme | 24 | * | * |
| Research | Health Services and Delivery Research | 43 | 69.8% | 30.2% |
| Research | Health Technology Assessment | 116 | 48.3% | 51.7% |
| Research | Invention for Innovation | 64 | 37.5% | 62.5% |
| Research | Policy Research Programme | 58 | 46.6% | 53.4% |
| Research | Programme Development Grants | 11 | * | * |
| Research | Programme Grants for Applied Research | 96 | 36.5% | 63.5% |
| Research | Public Health Research | 43 | 48.8% | 51.2% |
| Research | Research for Patient Benefit | 179 | 55.3% | 44.7% |
| NIHR (GHR) Committee Members Sex by Programme | ||||
| Career Development | Academic Career Development in NIHR Infrastructure and NIHR Schools (GHR) | 7 | * | * |
| Career Development | NIHR Global Research Professorships | 16 | * | * |
| Research | Global Health Policy and Systems Research | 16 | * | * |
| Research | Global Health Research Units and Groups | 35 | 42.9% | 57.1% |
| Research | Research and Innovation for Global Health Transformation | 55 | 43.6% | 56.4% |
* Indicates that the number of responses for one or more categories was less than 10 and so cannot be reported.
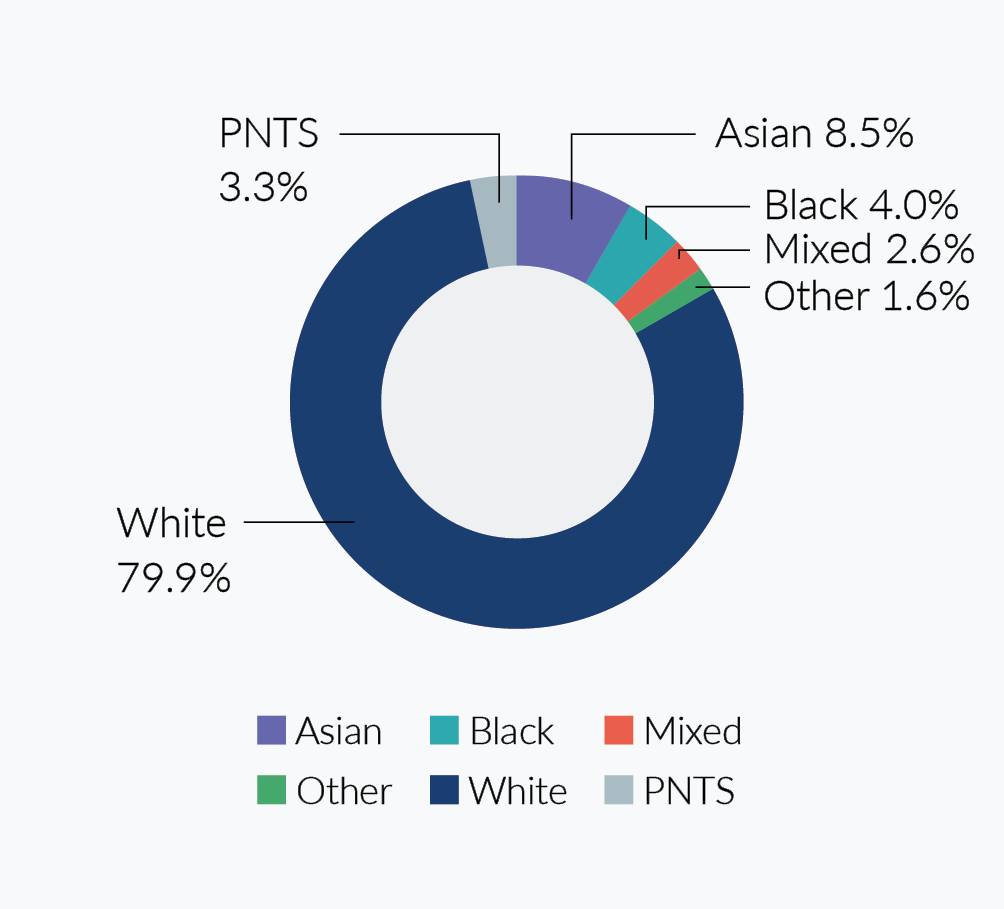
Selection committee members – ethnicity
Respondents could choose from a selection of eighteen ethnicity options, or select ‘Prefer not to say’. There were no responses in the NIHR Selection Committee Members data for ‘Black/African/ Caribbean/Black British - Any other Black/African/ Caribbean background’, ‘Mixed/Multiple Ethnic Groups - White and Black Caribbean’ and ‘White - Gypsy or Irish Traveller’. Ethnicities have been grouped to correspond to categories used in wider population data and to ensure minimum numbers for reporting aggregated data are met. For this analysis, the ‘White’ category includes white minority ethnicities.
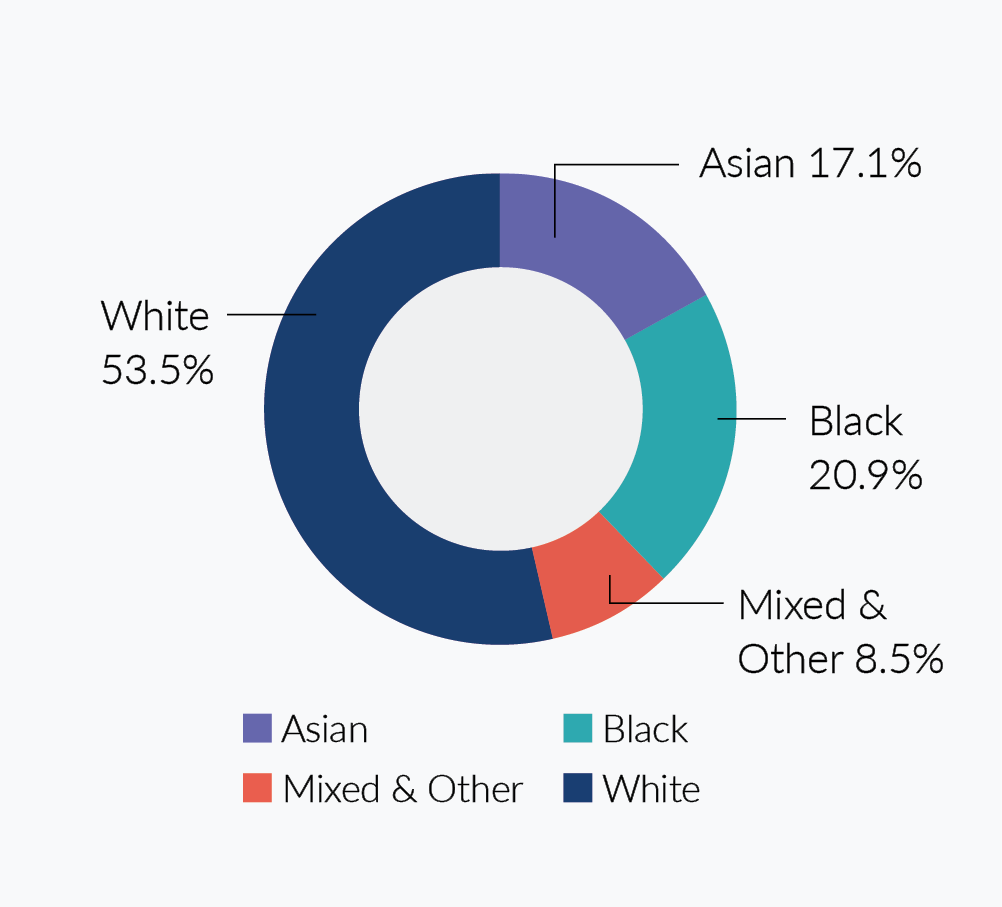
Overall 79.9% of committee members who responded were white and 16.7% were from other ethnic groups combined. For non-GHR programmes 83.1% of respondents were white and 13.1% were from other ethnic groups combined. The proportion of respondents from other ethnic groups to white ethnicity was considerably higher for global health programme committee member respondents (46.5% versus 53.5%).
NIHR Committee Members by Ethnicity – overall n = 1197
A pie chart with a sample size of 1197 showing 79.9% white, 8.5% Asian, 4.0% black, 2.6% mixed, 1.6% other and 3.3% prefer not to say.
NIHR Committee Members by Ethnicity – GHR only n = 129
A pie chart with a sample size of 129 showing 53.5% white, 17.1% Asian, 20.9% black and 8.5% mixed and other.
Selection committee members – ethnicity by programme type
There is a notable difference between the percentage of all other ethnic groups on selection committees for career development (10.7%) and research (19.0%).
This ratio is similar when GHR is excluded. For overall committee members, the proportion of all other ethnic groups on selection committees overall (16.7%) is very close to that for HESA academic staff in NIHR-related disciplines (16.0%) but this drops to 13.1% when GHR committees are excluded.
NIHR Committee Members by Ethnicity by Programme Type – overall
| Programme Type | Number of Respondents | White | All other ethnic groups |
|---|---|---|---|
| All | 1197 | 79.9% | 16.7% |
| Career Development | 328 | 83.5% | 10.7% |
| Research | 869 | 78.6% | 19.0% |
NIHR Committee Members by Ethnicity by Programme Type – excluding GHR
| Programme Type | Number of Respondents | White | All other ethnic groups |
|---|---|---|---|
| All | 1068 | 83.1% | 13.1% |
| Career Development | 305 | 85.2% | 8.5% |
| Research | 763 | 82.3% | 14.9% |
Selection committee members – ethnicity by member role
A smaller percentage of public committee member respondents were from an ethnic minority group than their professional counterparts although this is less noticeable when GHR data is excluded. Note that for this analysis, PNTS responses were excluded as the numbers for this category did not comply with the agreed minimum for reporting aggregated data when broken down by member type. When considering this comparison, the difference in the number of responses for each member type (professional = 1045, public = 113) should be noted. As there were only 5 public member responses for global health, it was not possible to present this data.
NIHR Committee Members by Ethnicity by Member Role – overall
| Committee Type | Number of Respondents | White | All other ethnic groups |
|---|---|---|---|
| All | 1157 | 82.7% | 17.3% |
| Professional | 1045 | 82.2% | 17.8% |
| Public | 112 | 87.5% | 12.5% |
NIHR Committee Members by Ethnicity by Member Role – excluding GHR
| Committee Type | Number of Respondents | White | All other ethnic groups |
|---|---|---|---|
| All | 1028 | 86.4% | 13.6% |
| Professional | 921 | 86.2% | 13.8% |
| Public | 107 | 87.9% | 12.1% |
Selection committee members – ethnicity by programme
All programmes had at least one committee member from an ethnic minority group. However, there is considerable variance in the proportions of committee member respondents from other ethnic groups between programmes, with the percentage for programmes where data can be reported ranging from 7.1% (Career Development – NIHR Fellowships) to 54.3% (Research – Research and Innovation for Global Health Transformation).
Data can only be reported where the number of responses for each category meets the agreed minimum requirements for reporting aggregated data. PNTS responses have been excluded to maximise the number of programmes for which data could be presented.
The numbers of global health responses for some categories fall below the agreed minimum for reporting aggregated data when broken down by programme type so data has been rounded in line with convention.
NIHR Committee Members Ethnicity by Programme
| Programme Type | Programme | Number of Responses (Excluding PNTS) | White | All Other Ethnic Groups |
|---|---|---|---|---|
| NIHR (excluding GHR) Committee Members Ethnicity by Programme | ||||
| Career Development | Academic Career Development in NIHR Infrastructure and NIHR Schools (excluding GHR) | 8 | * | * |
| Career Development | HEE/NIHR Integrated Clinical Academic Programme | 85 | * | * |
| Career Development | NIHR Fellowships | 141 | 92.9% | 7.1% |
| Career Development | NIHR Integrated Academic Training Programme | 8 | * | * |
| Career Development | NIHR Research Professorships | 15 | * | * |
| Career Development | Senior Investigator | 29 | * | * |
| Research | Artificial Intelligence | 57 | 73.7% | 26.3% |
| Research | Cross Programme | 24 | * | * |
| Research | Efficacy and Mechanism Evaluation | 29 | * | * |
| Research | Evidence Synthesis Programme | 24 | * | * |
| Research | Health Services and Delivery Research | 42 | * | * |
| Research | Health Technology Assessment | 115 | 87.0% | 13.0% |
| Research | Invention for Innovation | 63 | 84.1% | 15.9% |
| Research | Policy Research Programme | 56 | 82.1% | 17.9% |
| Research | Programme Development Grants | 10 | * | * |
| Research | Programme Grants for Applied Research | 98 | 84.7% | 15.3% |
| Research | Public Health Research | 43 | 74.4% | 25.6% |
| Research | Research for Patient Benefit | 181 | 89.0% | 11.0% |
| NIHR (GHR) Committee Members Ethnicity by Programme | ||||
| Career Development | Academic Career Development in NIHR Infrastructure and NIHR Schools (GHR) | 7 | * | * |
| Career Development | NIHR Global Research Professorships | 16 | * | * |
| Research | Global Health Policy and Systems Research | 16 | * | * |
| Research | Global Health Research Units and Groups | 35 | 45.7% | 54.3% |
| Research | Research and Innovation for Global Health Transformation | 55 | 54.5% | 45.5% |
* Indicates that the number of responses for one or more categories was less than 10 and so cannot be reported.
Selection committee members – disability
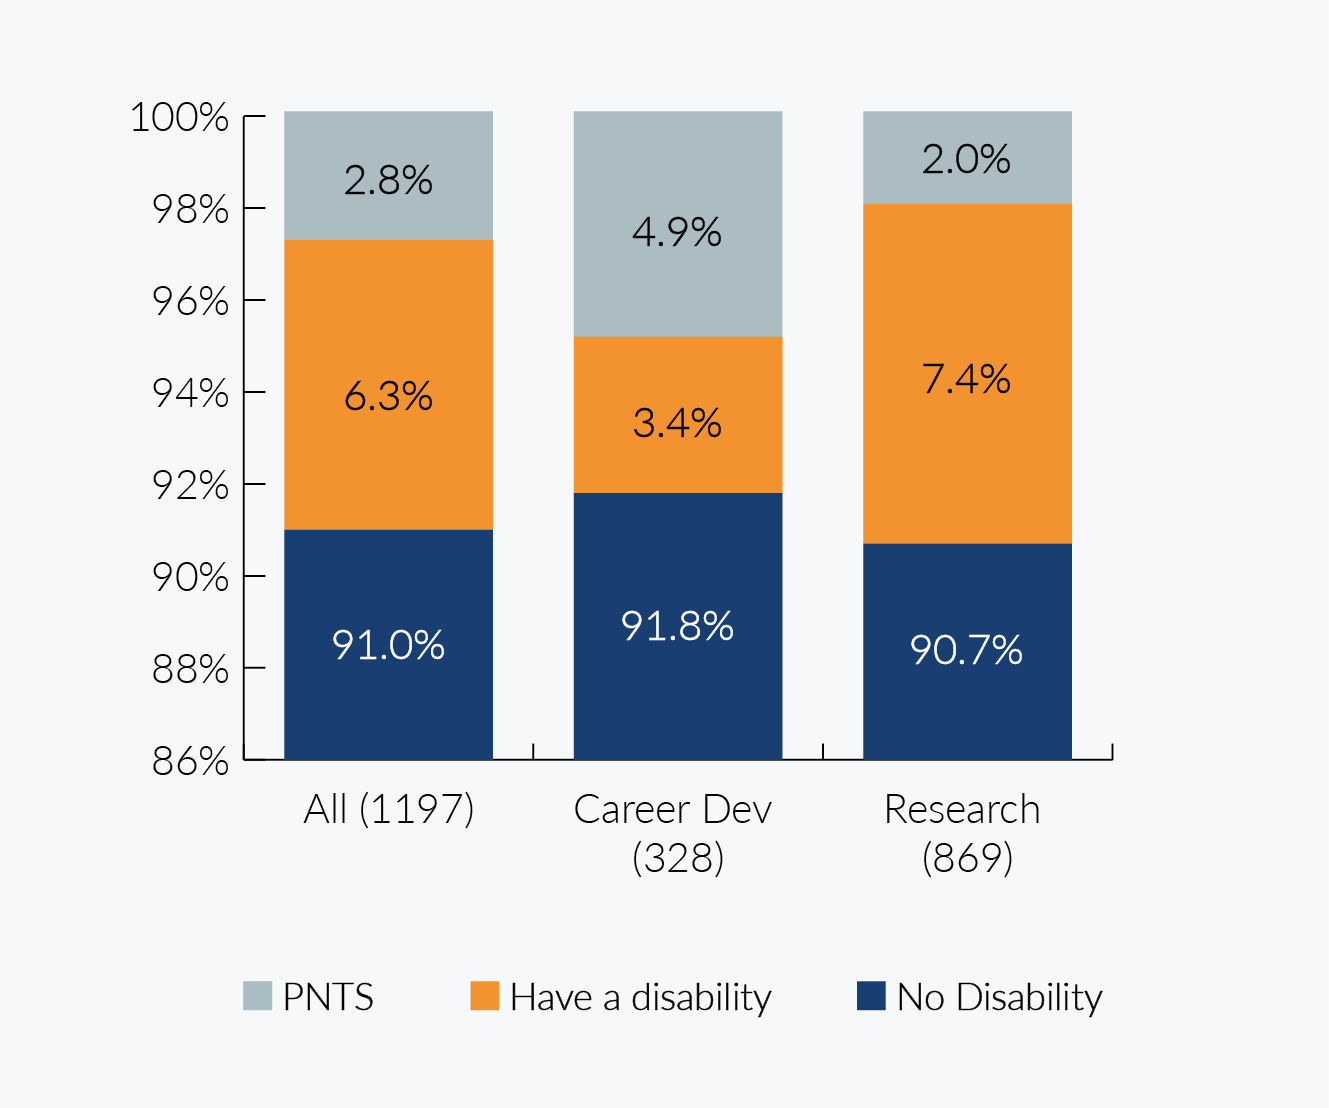
The proportion of committee members with a disability is more than double for research programmes (7.4%) than for career development programmes (3.4%). These numbers are mirrored when GHR data is excluded (7.7% versus 3.3%). There is also a considerable variance in the proportion of committee member respondents with a disability between programmes, with the percentage for programmes with at least 10 respondents ranging from 0% to 18.2%.
The proportion of respondents with a disability for career development committees is lower than for HESA academic staff (4.5%) and other funders - both overall and when GHR responses are excluded. However, the proportion of research programme committee member respondents with a disability is higher than for all comparators - both overall and when GHR responses are excluded.
NIHR Committee Members Disability by Programme Type
A bar chart showing:
All programme types 6.3% have a disability 91.0% no disability 2.8% prefer not to say, from a sample of 1197.
Career development 3.4% have a disability 91.8% no disability 4.9% prefer not to say, from a sample of 328.
Research 7.4% have a disability 90.7% no disability 2.0% prefer not to say, from a sample of 869.
Selection committee members – disability by member role
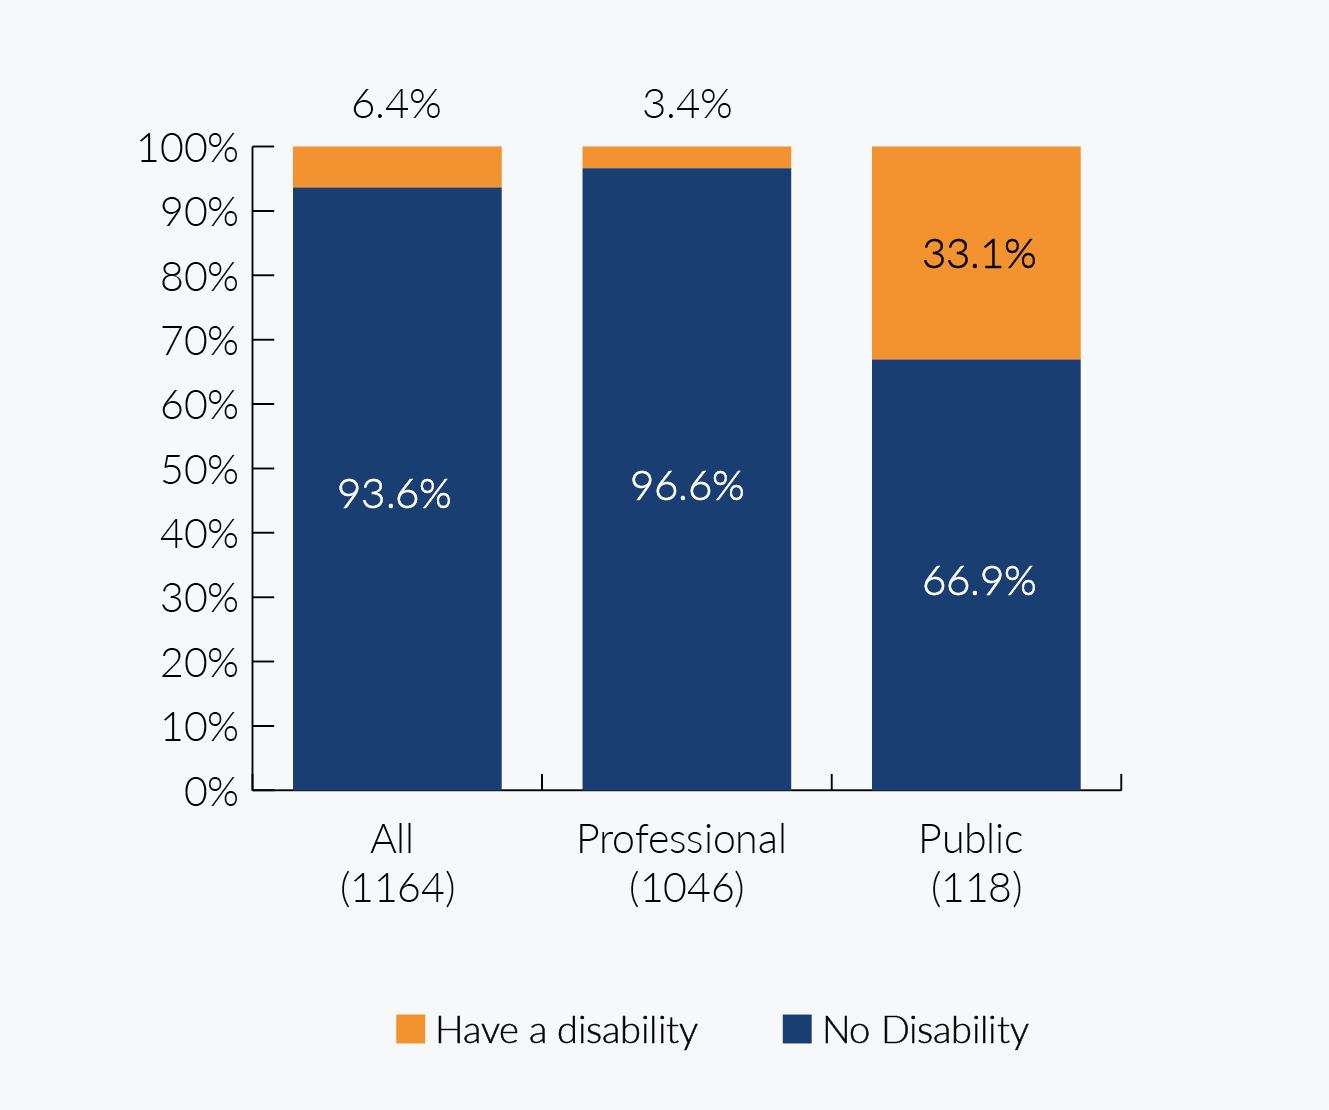
Significantly, the percentage of all public committee members with a disability (33.1%) is almost ten times that of their professional counterparts (3.4%). This is also true when GHR committee members are excluded (32.7% versus 3.5%). PNTS responses were excluded as the numbers for this category did not comply with the agreed minimum for reporting aggregated data when broken down by member type. When considering this comparison, the difference in the number of responses for each member type (professional = 1046, public = 118) should also be taken into account. As there were only 5 public member responses for global health, it was not possible to present this data.
NIHR Committee Members Disability by Member Role
A bar chart showing:
All programme types 6.4% have a disability 93.6% No disability, from a sample of 1164.
Professional 3.4% have a disability 96.6% no disability, from a sample of 1046.
Public 33.1% have a disability 66.9% no disability, from a sample of 118.
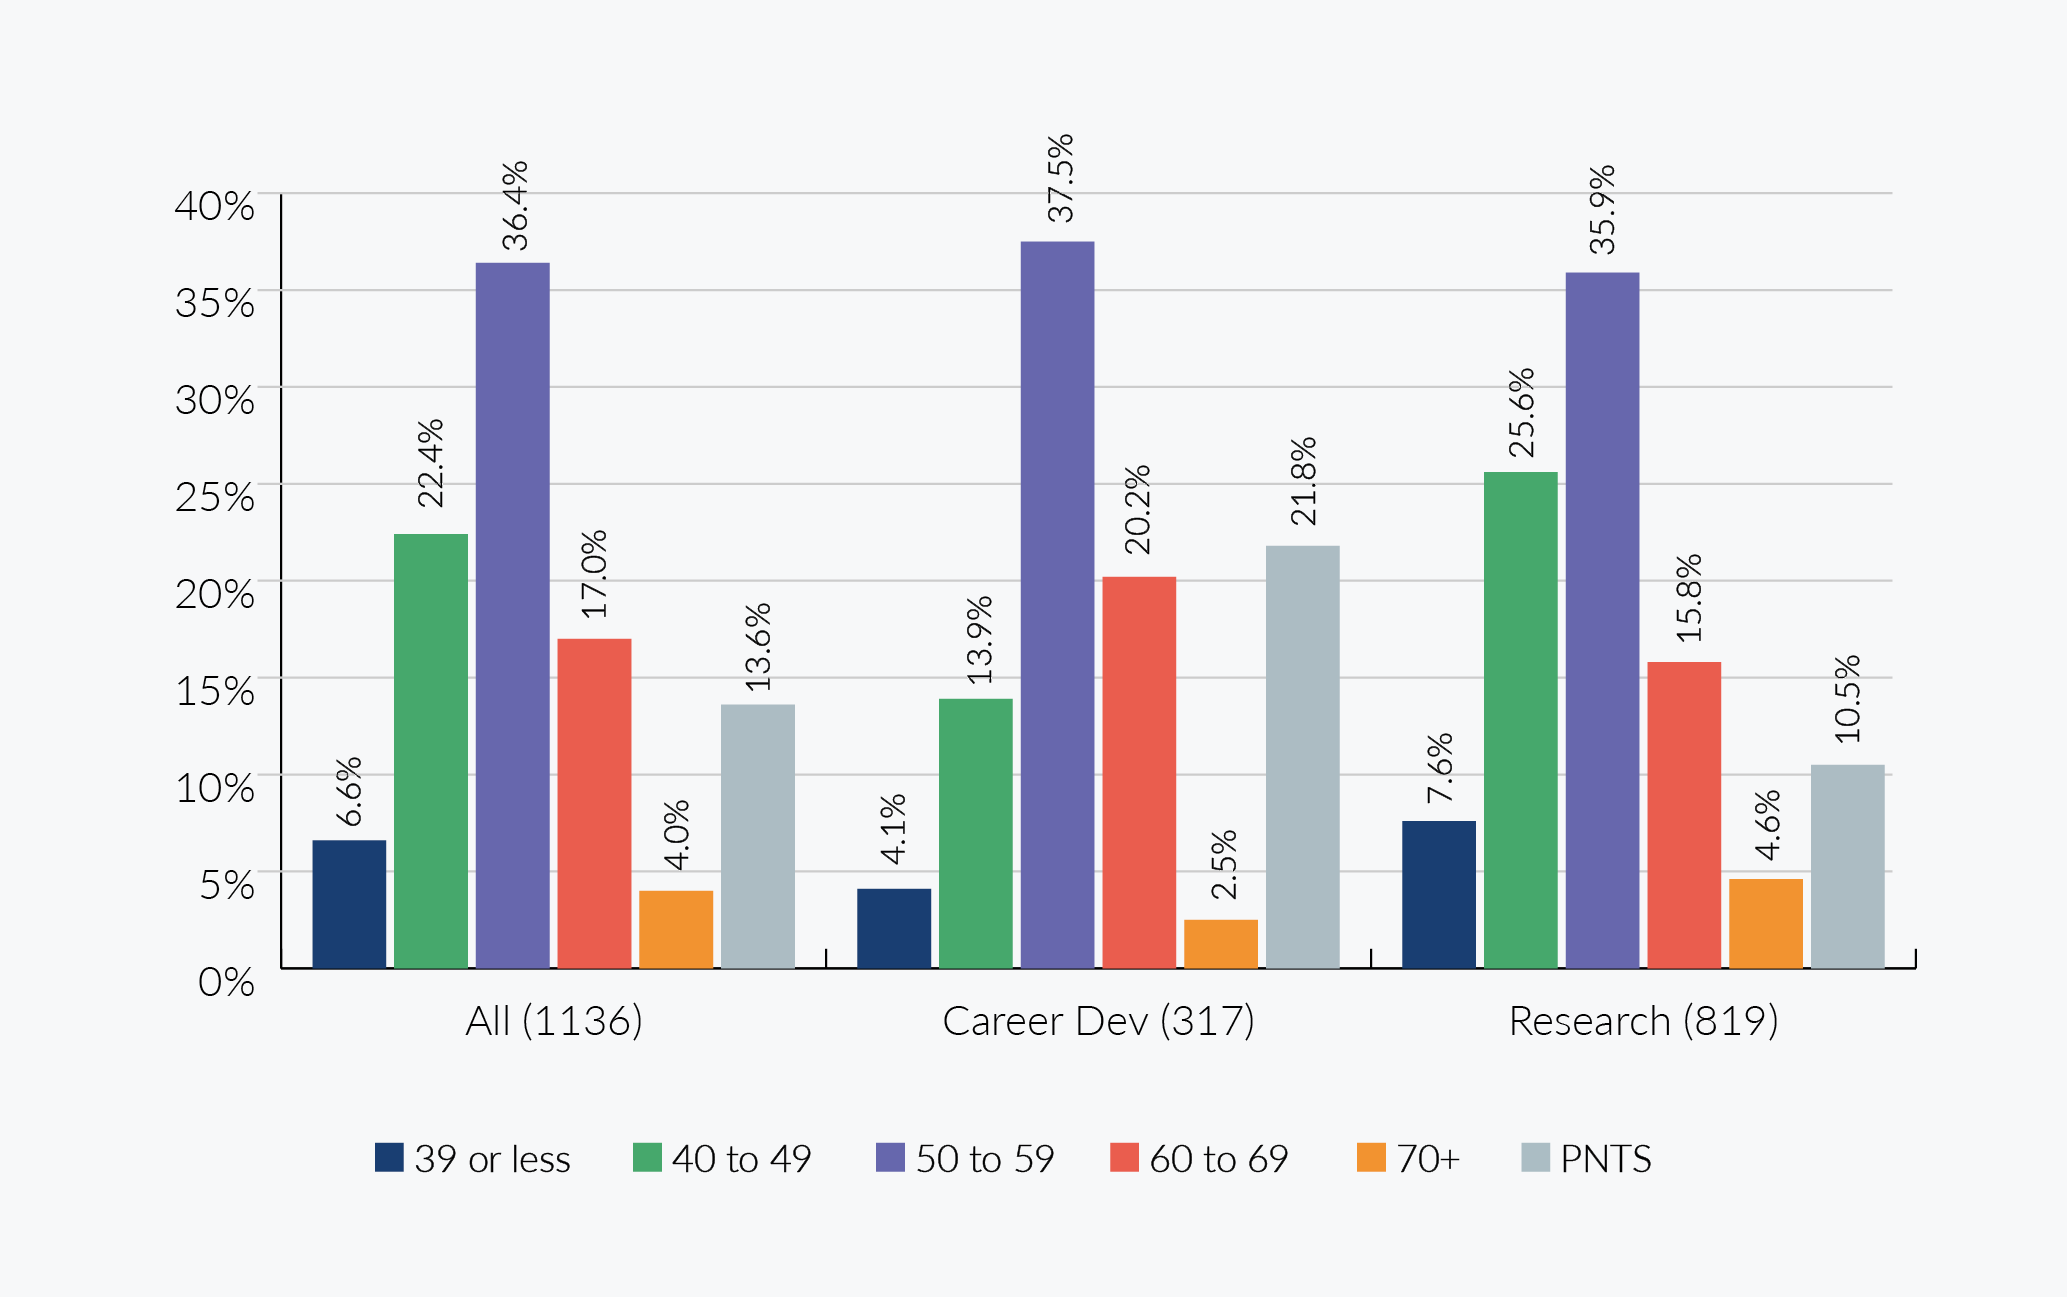
Selection committee members – age
Across all NIHR responses, the proportion of career development programme committee members aged under 50 is just over half that of their research counterparts (18.0% versus 33.2%). Career development respondents also had a slightly higher average age (55.4) compared to research (53.4). However, the 50 to 59 age group is the most common for both groups, with only a negligible difference between both groups. It has not been possible to provide a breakdown of committees by career stage for this year’s analysis.
NIHR Committee Members Age by Programme Type
A bar chart showing all committee members by age, all programme types, 6.6% 39 or less, 22.4% 40 to 49, 36.4% 50 to 59, 17.0% 60-69, 4.0% 70+, 13.6% prefer not to say, from a sample of 1136.
A bar chart showing career development committee members by age, 4.1% 39 or less, 13.9% 40 to 49, 37.5% 50 to 59, 20.2% 60 to 69, 2.5% 70+, 21.8% prefer not to say, from a sample of 317.
A bar chart showing research committee members by age, 7.6% 39 or less, 25.6% 40 to 49, 35.9% 50 to 59, 15.8% 60 to 69, 4.6% 70+, 10.5% prefer not to say, from a sample of 819.
Selection committee members – age by member role
Overall, public member respondents have an older age profile than their professional counterparts with 84.6% aged over 50 compared to 64.3%. Similarly, the average age for public members was 61 compared to 53 for professional members. When considering this comparison, the difference in the number of responses for each member type (professional = 817, public = 104) should be considered. PNTS responses were excluded as the numbers for this category did not comply with the agreed minimum for reporting aggregated data when broken down by member type.
NIHR Committee Members Age – Professional n = 877
A bar chart with a sample size of 877 showing:
8.0% 39 or less, 27.7% 40 to 49, 43.9% 50 to 59, 17.4% 60 to 69, 3.0% 70+.
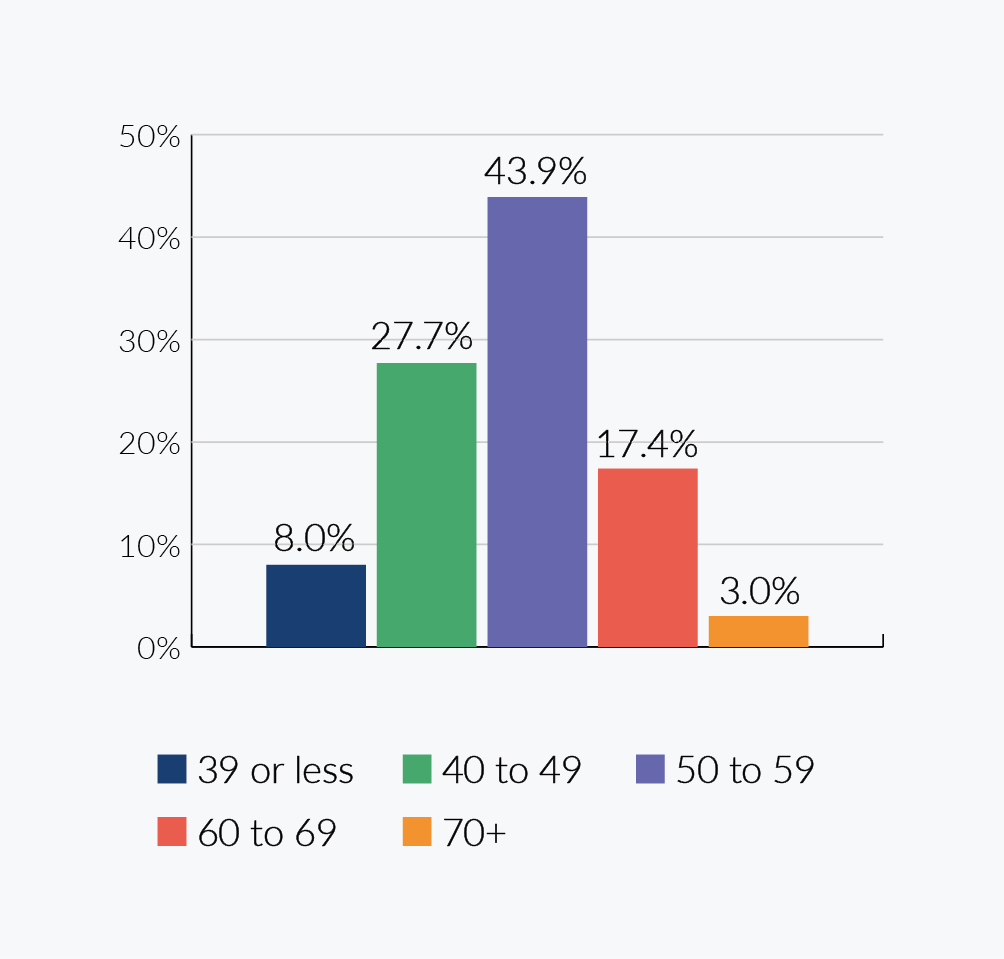
NIHR Committee Members Age – Public n = 104
A bar chart with a sample size of 104 showing:
15.4% 30 to 49, 26.9% 50 to 59, 38.5% 60 to 69, 19.2% 70+.
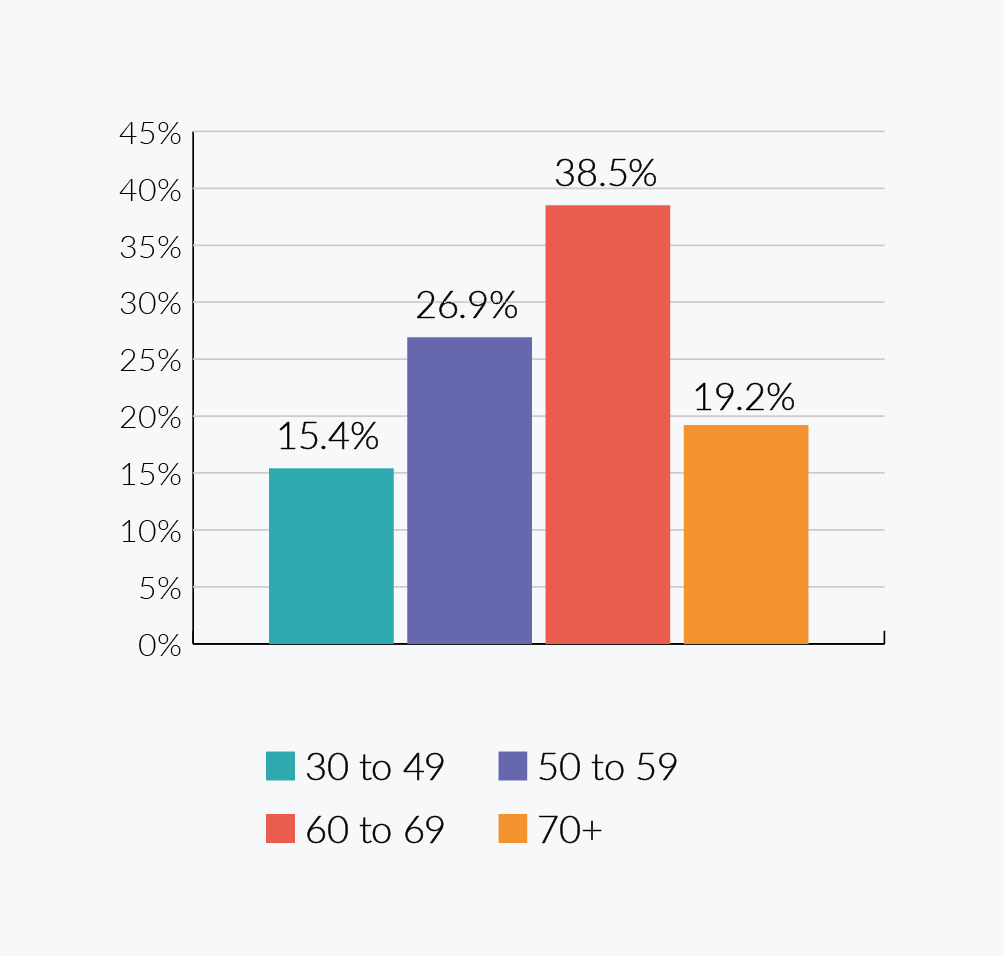
Selection committee members – age by programme
There is some variance in the average age of committee members by programme with the figure for programmes with 10 or more valid responses ranging from 49.5 (Research – Artificial Intelligence) to 62.2 (Career Development – Senior Investigator). The average ages for members of the more advanced career stage awards are higher than the average overall for career development awards
and research programmes.
Individual selection committees within ICA and Fellowships are not presented separately.
NIHR Committee Members Average Age by Programme
| Programme Type | Programme | Number of Valid Age Responses (Excluding PNTS) | Average Age |
|---|---|---|---|
| NIHR (excluding GHR) Committee Members Average Age by Programme | |||
| Career Development | Academic Career Development in NIHR Infrastructure and NIHR Schools (excluding GHR) | 8 | * |
| Career Development | HEE/NIHR Integrated Clinical Academic (ICA) Programme | 67 | 54.4 |
| Career Development | NIHR Fellowships | 106 | 54.7 |
| Career Development | NIHR Integrated Academic Training Programme | 6 | * |
| Career Development | NIHR Research Professorships | 13 | 58.7 |
| Career Development | Senior Investigator | 27 | 62.2 |
| Research | Artificial Intelligence | 44 | 49.5 |
| Research | Cross Programme | 20 | 58.8 |
| Research | Efficacy and Mechanism Evaluation | 29 | 53.9 |
| Research | Evidence Synthesis Programme | 21 | 54.6 |
| Research | Health Services and Delivery Research | 35 | 51.9 |
| Research | Health Technology Assessment | 98 | 52.5 |
| Research | Invention for Innovation | 54 | 52.4 |
| Research | Policy Research Programme | 52 | 53.1 |
| Research | Programme Development Grants | 8 | * |
| Research | Programme Grants for Applied Research | 79 | 56.0 |
| Research | Public Health Research | 40 | 51.9 |
| Research | Research for Patient Benefit | 158 | 51.0 |
| NIHR (GHR) Committee Members Average Age by Programme | |||
| Career Development | Academic Career Development in NIHR Infrastructure and NIHR Schools (GHR) | 6 | * |
| Career Development | NIHR Global Research Professorships | 15 | 57.4 |
| Research | Global Health Policy and Systems Research | 15 | 52.5 |
| Research | Global Health Research Units and Groups | 30 | 59.1 |
| Research | Research and Innovation for Global Health Transformation | 50 | 58.8 |
* Value cannot be reported as the number of valid responses was less than 10.
As a result of this exercise and in light of its conclusions, we instigated three complementary approaches to redress imbalances in the diversity of selection committees.
- The first was to introduce positive action statements and accessibility statements in recruitment to committees.
- Next, we began widening the reach of recruitment campaigns and adverts, for example, partnership with Black British Academics, to ensure that more people from more diverse backgrounds were exposed to these opportunities.
- We also put in train a process to set diversity targets for membership of our funding committees as part of our wider EDI strategy, to try to ensure that they are as representative as possible of the people the NIHR serves.
Reflections
Implications for developing a diverse talent pipeline
Sex:
- Applications for career development awards show broadly similar representation levels to current award holders, therefore the pipeline will maintain the status quo. The exception is at the Research Professor level, where a higher proportion of female applicants should improve representation of award holders over time.
- Applications for research programmes show a greater representation of females in applicants versus award holders so pipeline should improve female representation.
- We are concerned that the proportion of females declines as the career stage advances and work is underway to understand the barriers and enablers to career progression.
Ethnicity:
- There is a higher representation of other ethnic groups in applicants (20%) compared to award holders (approximately 15%). To build a stronger pipeline, action is needed to understand and address the causes of award rate disparity and increase the diversity of applicants.
Disability:
- The representation of those disclosing a disability is higher in applicants (3.4%) compared to award holders (2.3%), however, the PNTS for award holders (5.9%) is higher than the reported disability so implications for the pipeline are not clear at this time.
The application process itself
- We are striving to better understand the barriers researchers face when they apply to the NIHR.
- We have already improved the application process by giving applicants an opportunity to alert selection committees about any special mitigating factors.
- We are encouraging more people from different ethnic backgrounds to apply, through improving our communications processes and support mechanisms for applicants.
- Finally, we have instigated a process of continuous improvement when it comes to policies and interventions.
Actions being taken to improve diversity of Selection Committees
- We have already introduced positive action statements and accessibility statements in recruitment to committees and widened the reach of recruitment campaigns and advertisements, for example with our partnership with Black British Academics.
- In future we will set diversity targets for our funding committees as part of our wider EDI strategy to be as representative of the people the NIHR serves as possible. We will also review selection and recruitment processes for members of our funding committees and make necessary reasonable adjustments to ensure opportunities for recruitment to our committee are fair and equitable.
The NIHR’s mission is to improve the health and wealth of the nation through research. We deliver against this mission through six core workstreams:
- We fund high quality, timely research that benefits the NHS, public health and social care
- We invest in world-class expertise, facilities and a skilled delivery workforce to translate discoveries into improved treatments and services
- We partner with patients, service users, carers and communities, improving the relevance, quality and impact of our research
- We attract, train and support the best researchers to tackle complex health and care challenges
- We collaborate with other public funders, charities and industry to shape a cohesive and globally competitive research system
- We fund applied global health research and training to meet the needs of the poorest people in low and middle-income countries
For more information visit us at www.nihr.ac.uk
To contact us regarding our work to improve equality, diversity and inclusion get in touch at edi@nihr.ac.uk