Published: 23 November 2022
Version: 1.0 Award Funding and Selection Committees Analysis
Print this documentIntroduction
Welcome to NIHR’s second Diversity Data Report. This year’s report marks an important step in developing an evidence based approach to our equality, diversity and inclusion (EDI) work. It consolidates our understanding of the diversity challenges we face at the NIHR. It also helps us to establish a benchmark which we can use to measure our progress against in the future. This year’s report also includes analysis of application value and geographical location for the first time.
This year our findings paint a similar picture to last year:
- Applications from female researchers decline with higher career stage; from 71% for pre-doctoral programmes to 37% for senior investigator programmes.
- Applicants from ethnic minority groups are less likely to be successful than white applicants. People from ethnic minority groups are also underrepresented on our funding committees.
- The proportion of applicants, award holders and professional committee members who have declared a disability is low.
In the last year we have however begun to take action to improve our diversity. We will continue to do the work to address the barriers faced by our research applicants and our committee members, but we know this work will take time.
In September 2022, we published the NIHR Equality, Diversity and Inclusion (EDI) Strategy 2022-2027. The strategy sets out our commitment to overcoming the inequalities highlighted by our diversity data reports.
Our strategy will be accompanied by an action plan, published by the end of 2022. This plan will commit us to a programme of work to address the underrepresentation and biases in our systems and practices. It will include the development of a disability framework to ensure that disabled people and people with impairments feel welcome, included and supported at the NIHR. It will also include targeted work to improve the diversity of professional and public committee members.
One key theme of our strategy is to develop an evidence led approach to our EDI work. To do this we must improve the quality of our diversity data collection and analysis. We have therefore reviewed our data processes, and have developed a long term improvement plan. This review also prompted us to reassess our original commitment to publish diversity data annually.
As our methods are developing, annual publication does not allow us to show consistent data over consecutive years, and will hinder our ability to assess trends. It also does not allow enough time for us to show the impact of our EDI interventions. We will therefore move to publish data every 3 years. This means that our next full data report will follow in early 2026. Our next report will include multiple years of trend data, and more equality characteristics. NIHR will continue to annually collect and review data in house. And we will publicly share data highlights on our key priorities.
We welcome feedback on how we improve equality, diversity and inclusion in everything we do.
Method
A new Equality and Data Reporting System was introduced into our research management systems in 2020 to standardise the approach used to collect data from NIHR research applicants, award holders and committee members. This is the second report produced from the data collected using this system.
Who is covered by our data?
Data for each characteristic (age, disability, ethnicity, sex) has been analysed for each of the following categories of respondents from the NIHR’s domestic funding portfolio and its Global health portfolio between 1 April 2021 to 31 March 2022:
- Applications for funding: This group includes lead applicants and those with an equivalent status, who submitted applications for NIHR research or career development funding during 2021/22. This section also includes the application outcome for each lead applicant. 67% of applications made between 1 April 2021 and 31 March 2022 received a final funding decision by 31/03/2022. These are therefore included in the application outcomes analysis. To ensure we report complete data sets in the future, from 2023 applications will be grouped into financial years based on when the decision was made, rather than when the application was made.
- Award holders: This group is defined as all chief investigators, lead applicants and those with equivalent status in receipt of NIHR research or career development award funding during 2021/22.
- Selection committee members: This group is defined as people who were serving members of funding committees which make decisions on which applications were shortlisted, funded or rejected in 2021/22. Where there are no standing committee members, data is based on the pool of people eligible to attend. Observers and secretariat staff were excluded.
Where any individual engaged with more than one activity listed above, their EDI data was counted for each unique activity.
The minimum threshold for publication of individual numbers for any analysis related to equality, diversity and inclusion characteristics by NIHR is set as 10.
Global health programmes have much fewer applications and outcomes compared to the domestic portfolio. To ensure anonymity for Global health respondents, and in line with our minimum reporting requirements for data, we are unable to publish exact figures for many categories. We have combined categories to maximise the amount of data we can share.
We do not currently have a method in place to systematically collect data from any funding applicant, award holder or committee member that is not managed through our research management system. We are currently undertaking a piece of work to understand what proportion of our funding portfolio is not included in our reporting, and how we might collect this missing data.
What data did we collect and analyse?
- Data relating to four protected characteristics was collected: age, disability, ethnicity and sex, as defined by the Equality Act 2010.
- Age was collected via date of birth and data grouped into the following categories: aged 29 or less, 30 to 39, 40 to 49, 50 to 59, 60+ and “prefer not to say” (PNTS).
- Where we have sufficient numbers, ethnicity data is presented in the 5 aggregated ethnicity categories (Asian, Black, Mixed, Other, White), defined by the Office for National Statistics list of ethnicity groups. Where data does not reach minimum reporting criteria we will aggregate data from the Asian, Black, Mixed, and Other groups.
- Disability (yes/no/PNTS) and sex (male/female/PNTS) results are presented as collected, without modification.
Comparator data
- We created a subset of the Higher Education Statistical Authority (HESA) datasets for cost centres or disciplines relevant to NIHR.
How are we presenting data?
- Where possible, we are using the same style of chart to display the data throughout the report, in order to improve consistency and ensure the data is accessible.
- We have rounded numbers up or down to the nearest whole number for clarity and readability. This means that there may be some cases where the bars in our charts do not add up to 100.
- For our domestic portfolio, this report covers 2 types of funding: Those which support career development, and those which support research directly. Data for both programme types combined (all), and separate career development (career dev) type funding, and research type funding, are presented in the charts and described in the text throughout this report. Where possible and/ relevant, we have broken down each of the programme types into their constituent programmes. Data presented in the Global health section combines all programme types in order to meet minimum reporting criteria.
- We report award application values as the median throughout the report.
Abbreviations
We have used the following abbreviations and acronyms in the report:
- Career dev = Career development
- Postgrad students = Postgraduate students
- Prefer not to say = PNTS
Global health data
This year, Global health data is reported separately to recognise that this population includes people from lower and middle income countries. Including this data with our domestic portfolio may skew our findings. We know that our diversity questions and responses are UK centric, and are not relevant to an international population. We are currently developing a better approach for Global health data collection and reporting.
Limitations and future plans
This is our second year of data reporting, so we are still establishing our methods and baseline data. Future reports will present multiple years of data, to help identify trends and see the impact of our EDI interventions.
We have followed the guidance from the Centre for Racial and Ethnic Minorities Report on Racial Disparities in the UK (2021) in reporting data on ethnicity. Where possible we have presented the most granular data available using the five aggregated groups: White, Black, Asian, Mixed, and Other. There are cases in the report where, due to minimum data reporting rules, we have been unable to report data by specific ethnic groups and groups have been combined. This approach can mask the specific differences experienced by each ethnic group and severely limits the insight we can gather from the data. In the future, as our data set grows in size, we aim to provide ethnicity data broken down in the most detail possible.
Our research infrastructure, which includes Biomedical Research Centres, Clinical Research Facilities, and those involved in the Local Clinical Research Network are not included in this report. We recognise that this accounts for a large proportion of our funding and we are committed to developing mechanisms to collect this data.
As with last year’s report, there are a large number of PNTS responses for age. This is likely because we ask respondents for their date of birth and there may be concerns about identification and data protection. From 2023 onwards, the NIHR will collect respondents’ year of birth rather than their date of birth.
This year, we have benchmarked using data from the Higher Education Statistics Agency (HESA), which provides some useful context about how NIHR’s diversity compares to the diversity of the academic sector. However, NIHR researchers and committee members are not solely made up of people from higher education, so the HESA data does not give us the whole picture. In 2023, we will undertake a significant piece of work to better understand which sources of data are most appropriate to benchmark against.
NIHR is committed to developing researchers from multiple disciplines, specialisms, geographies and backgrounds. However we currently only collect data on 4 of the 9 characteristics protected under the Equality Act 2010. This limits our understanding of which groups are under-represented. We will expand our data collection to include all protected characteristics.
We have not undertaken statistical analysis, except for the likelihood of funding success between applicants from White and ethnic minority groups. Data should therefore be interpreted with caution. We will develop our approach to statistical analysis in the coming years.
Report highlights
Who applies for NIHR funding?
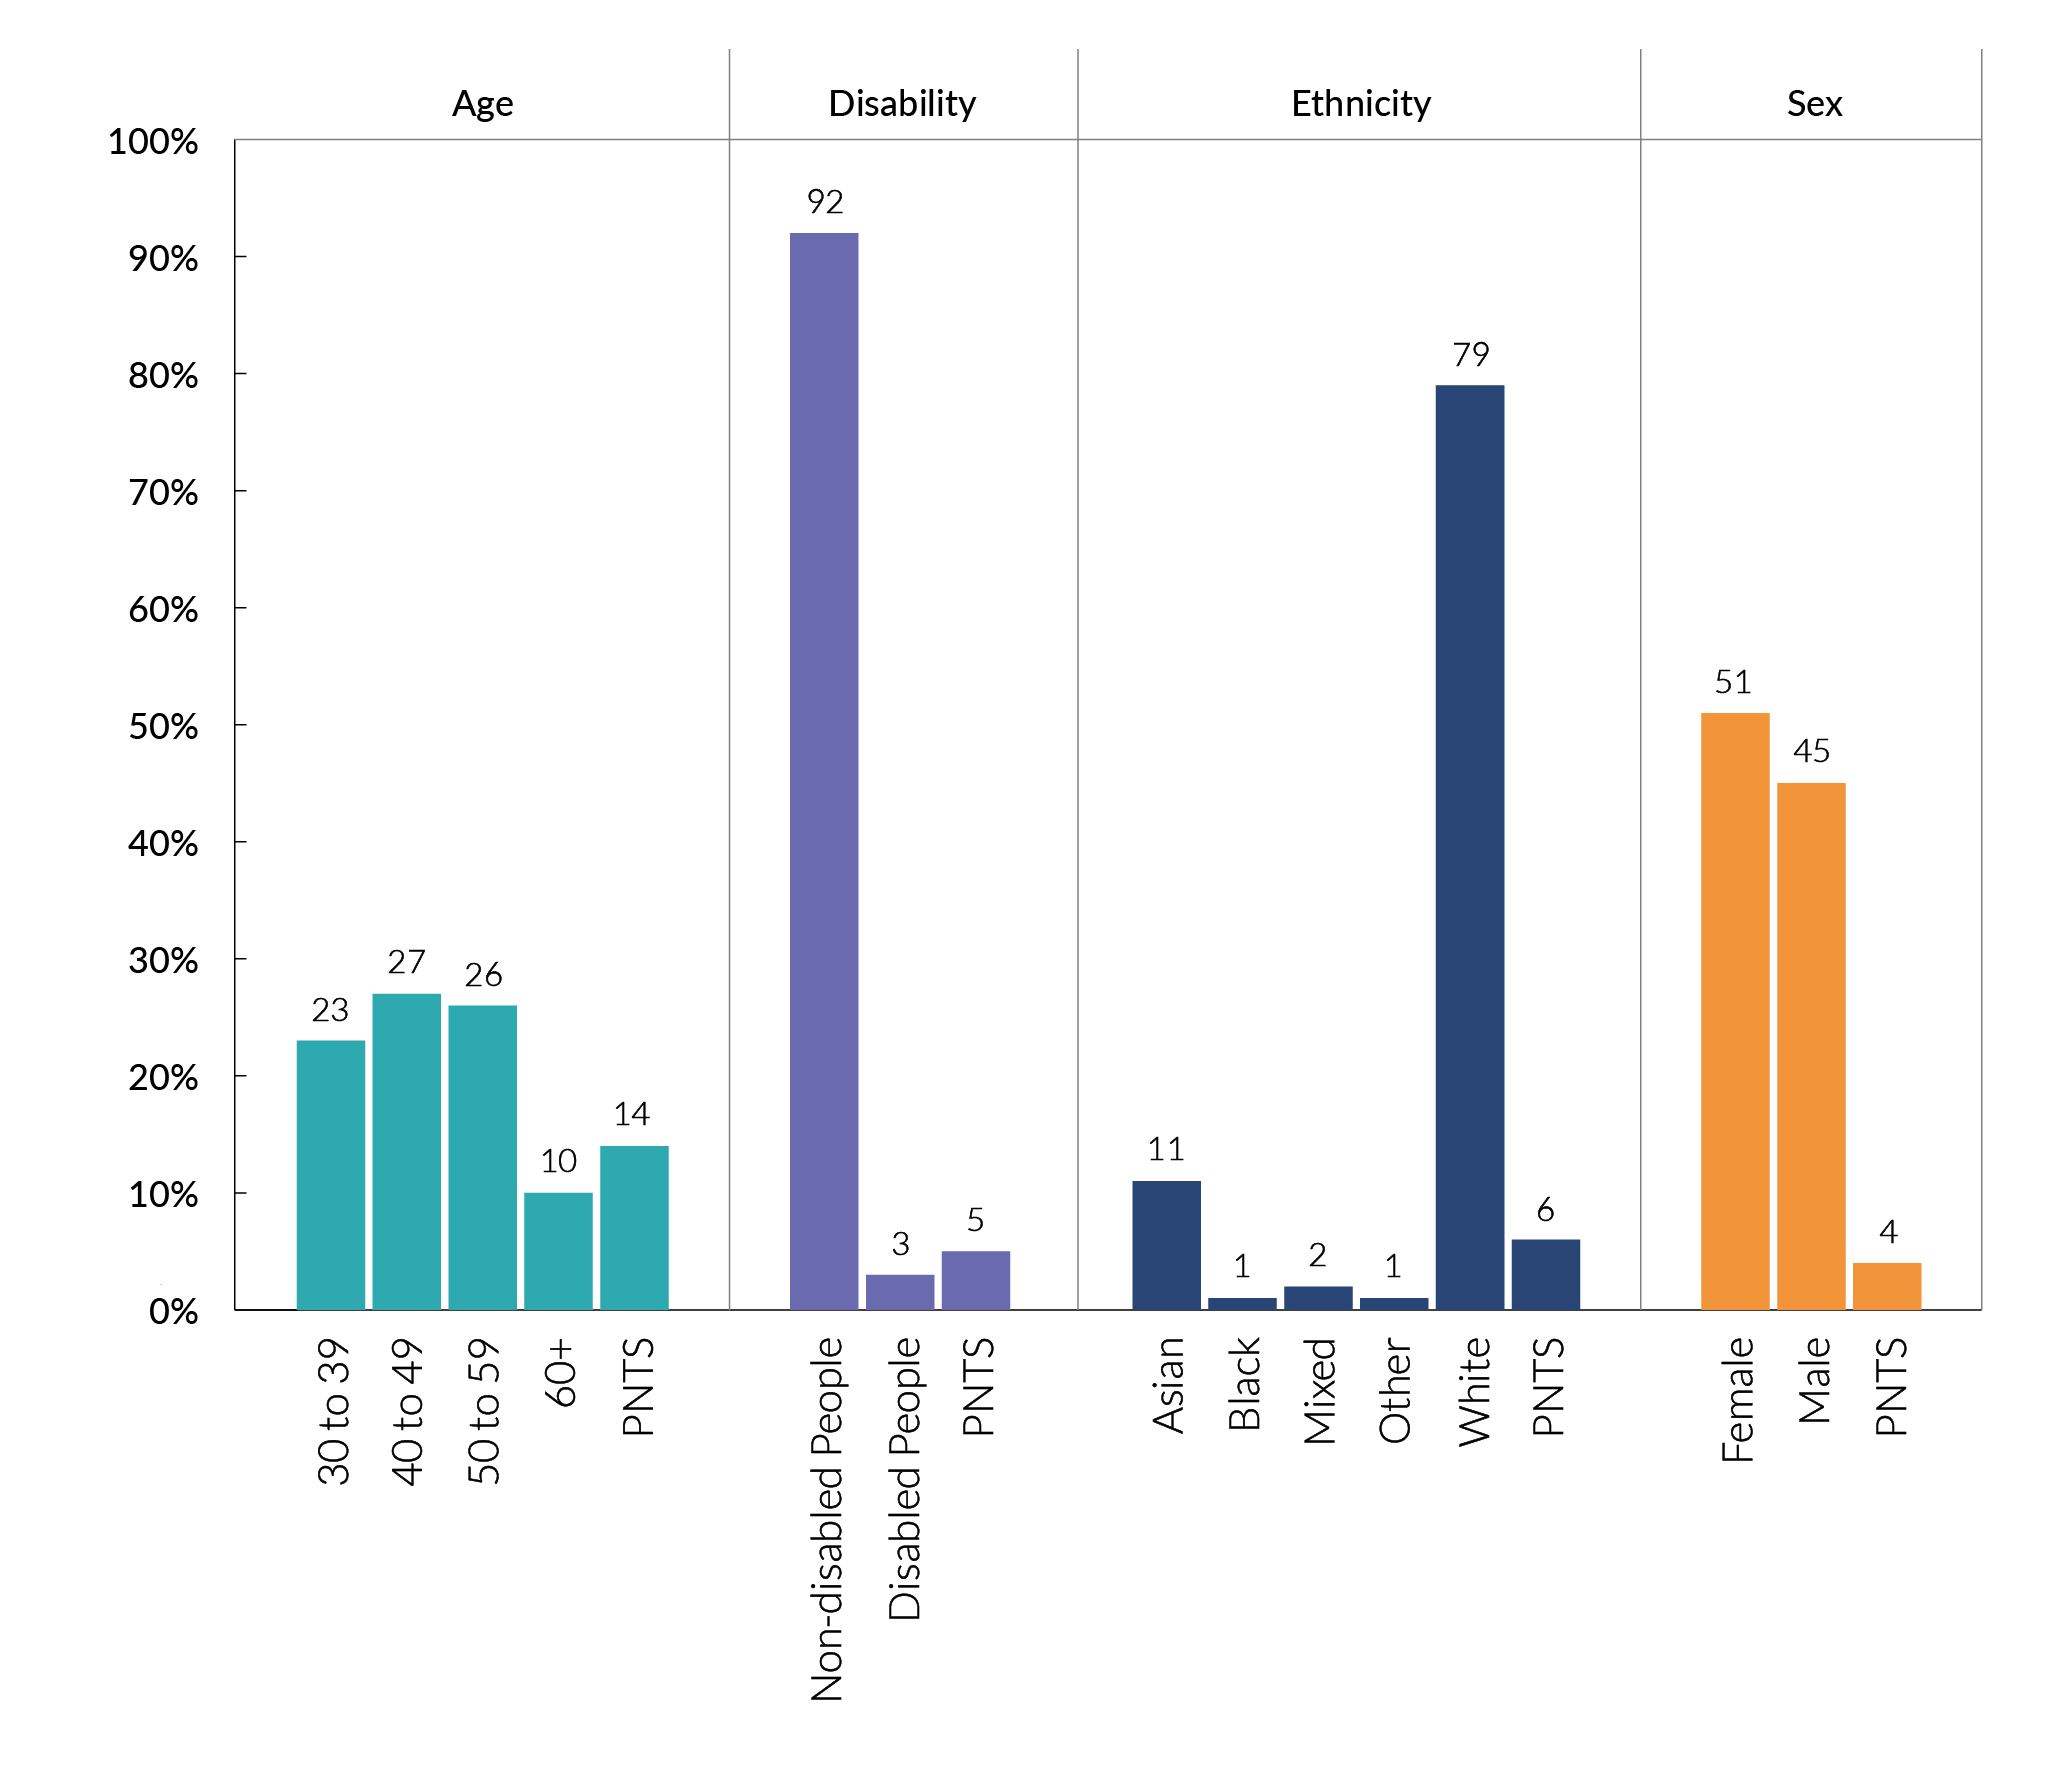
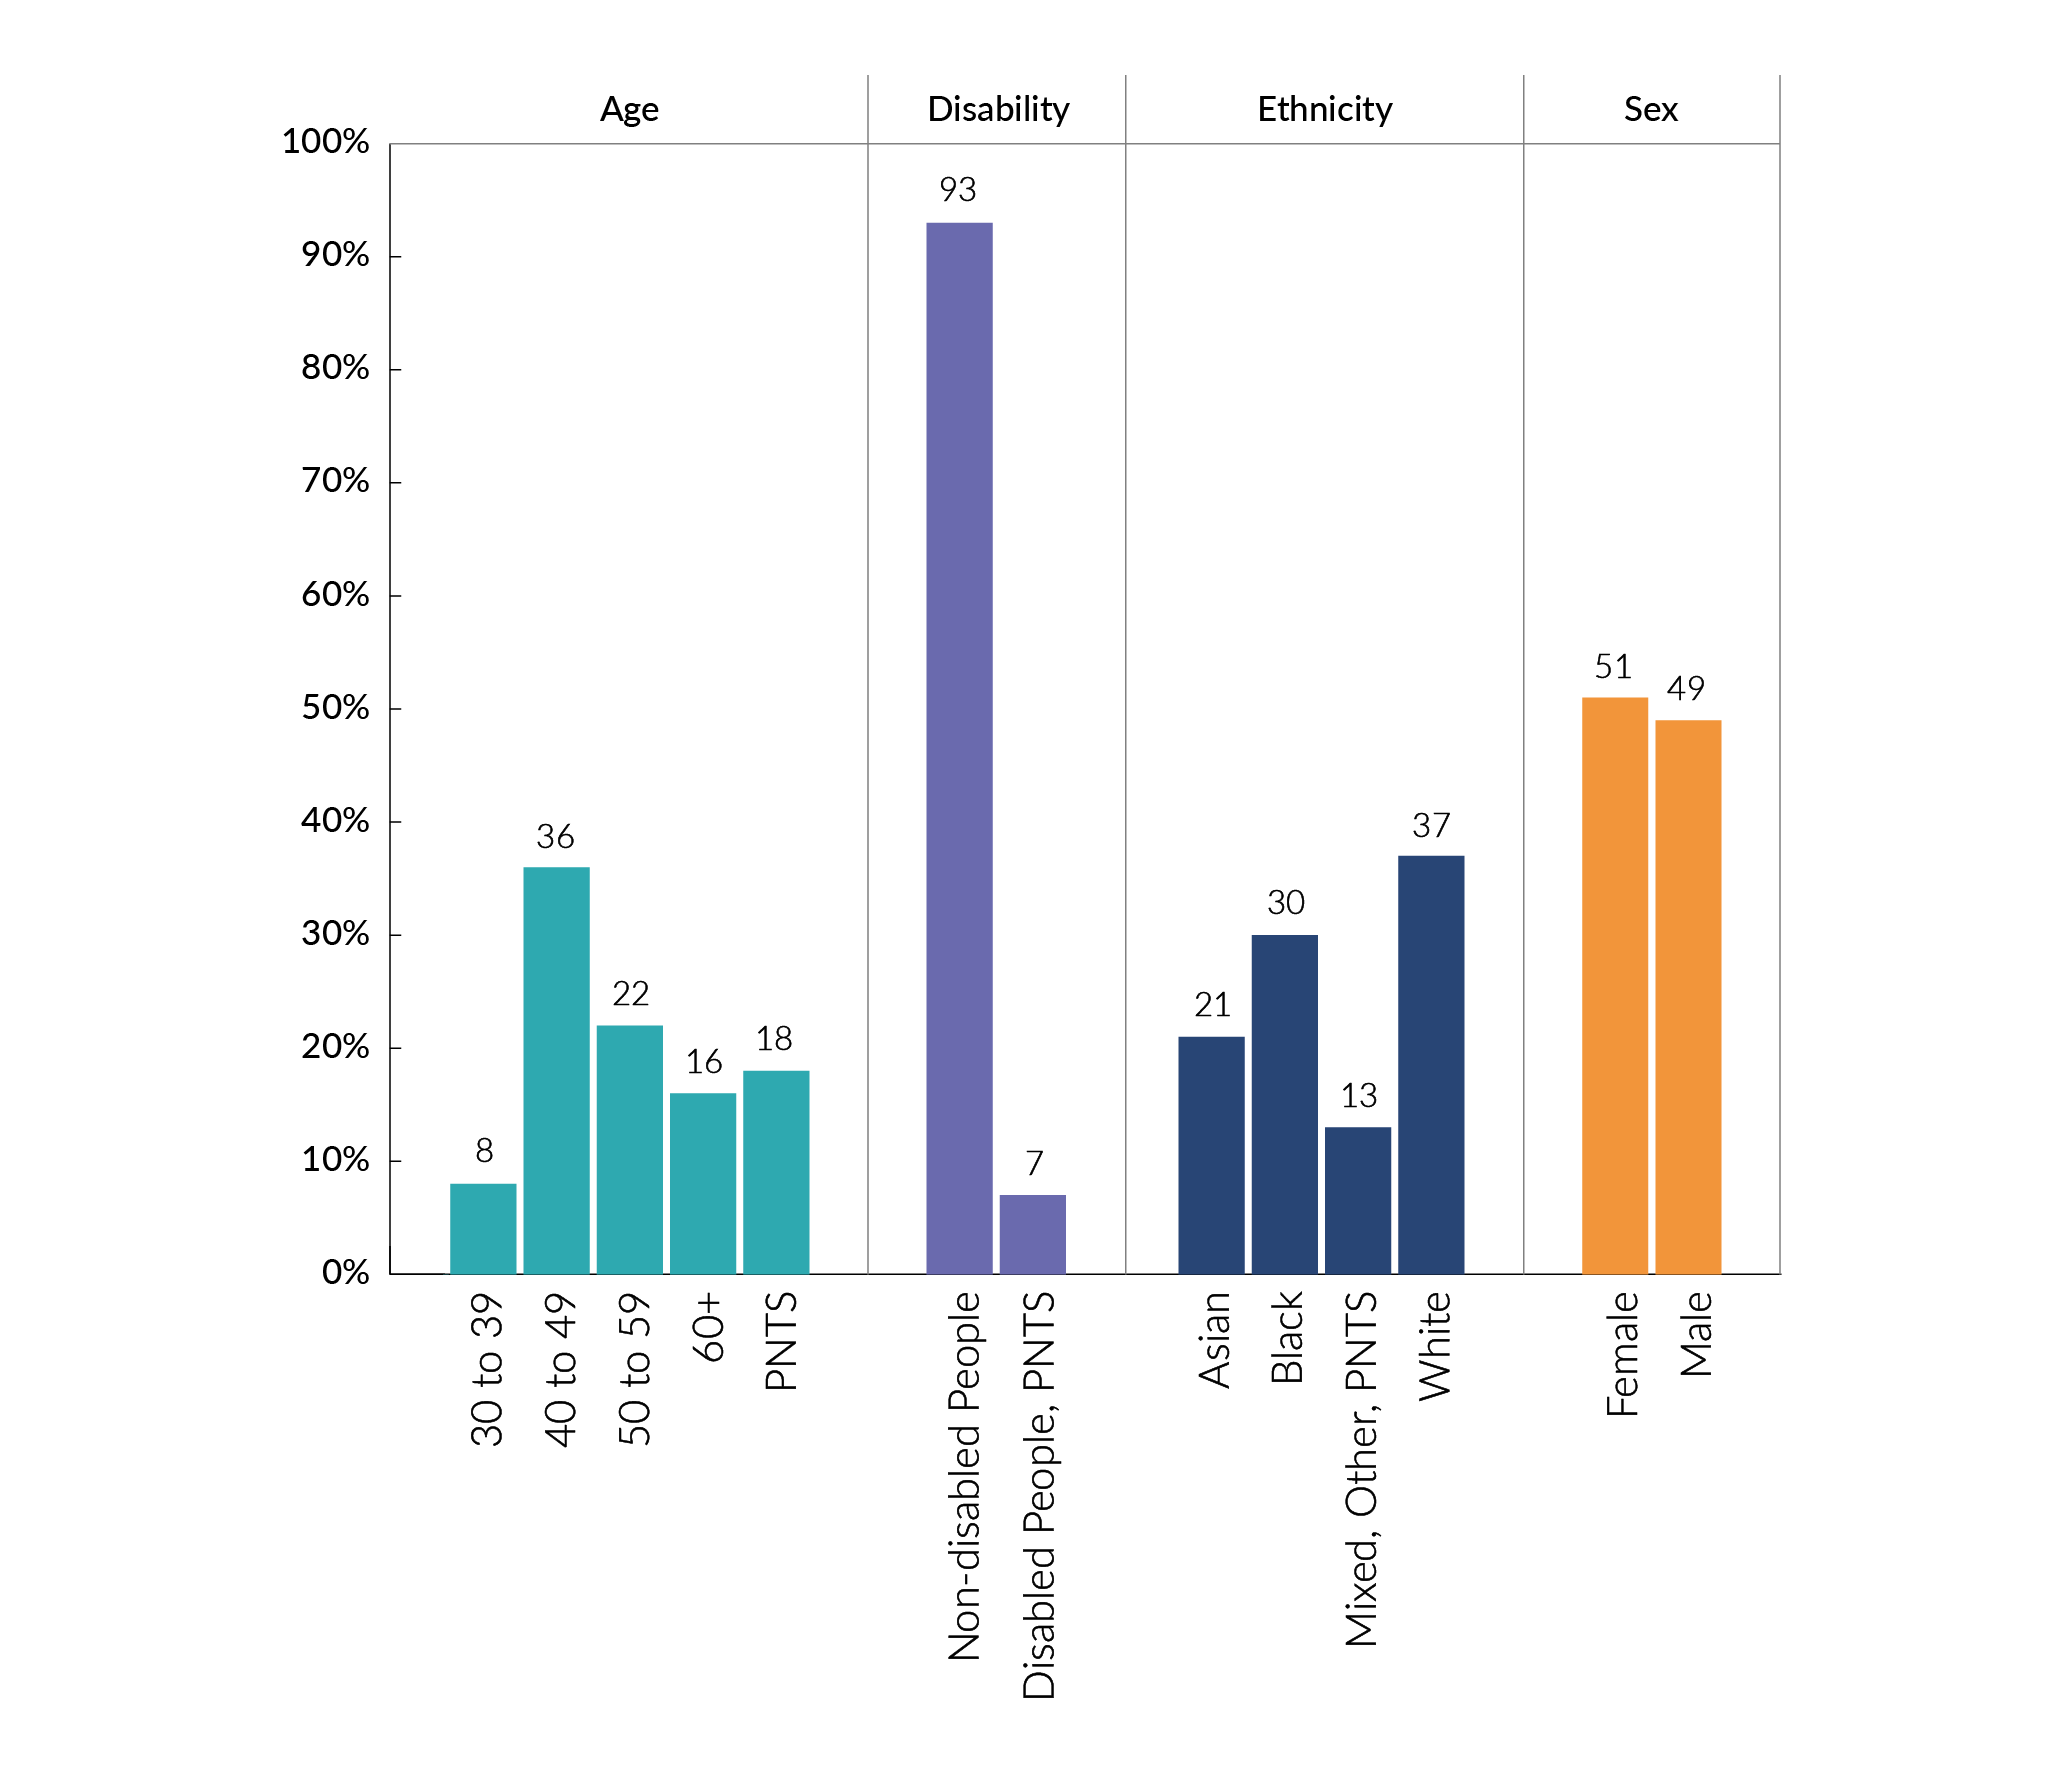
Chart 1. Who applies to NIHR?
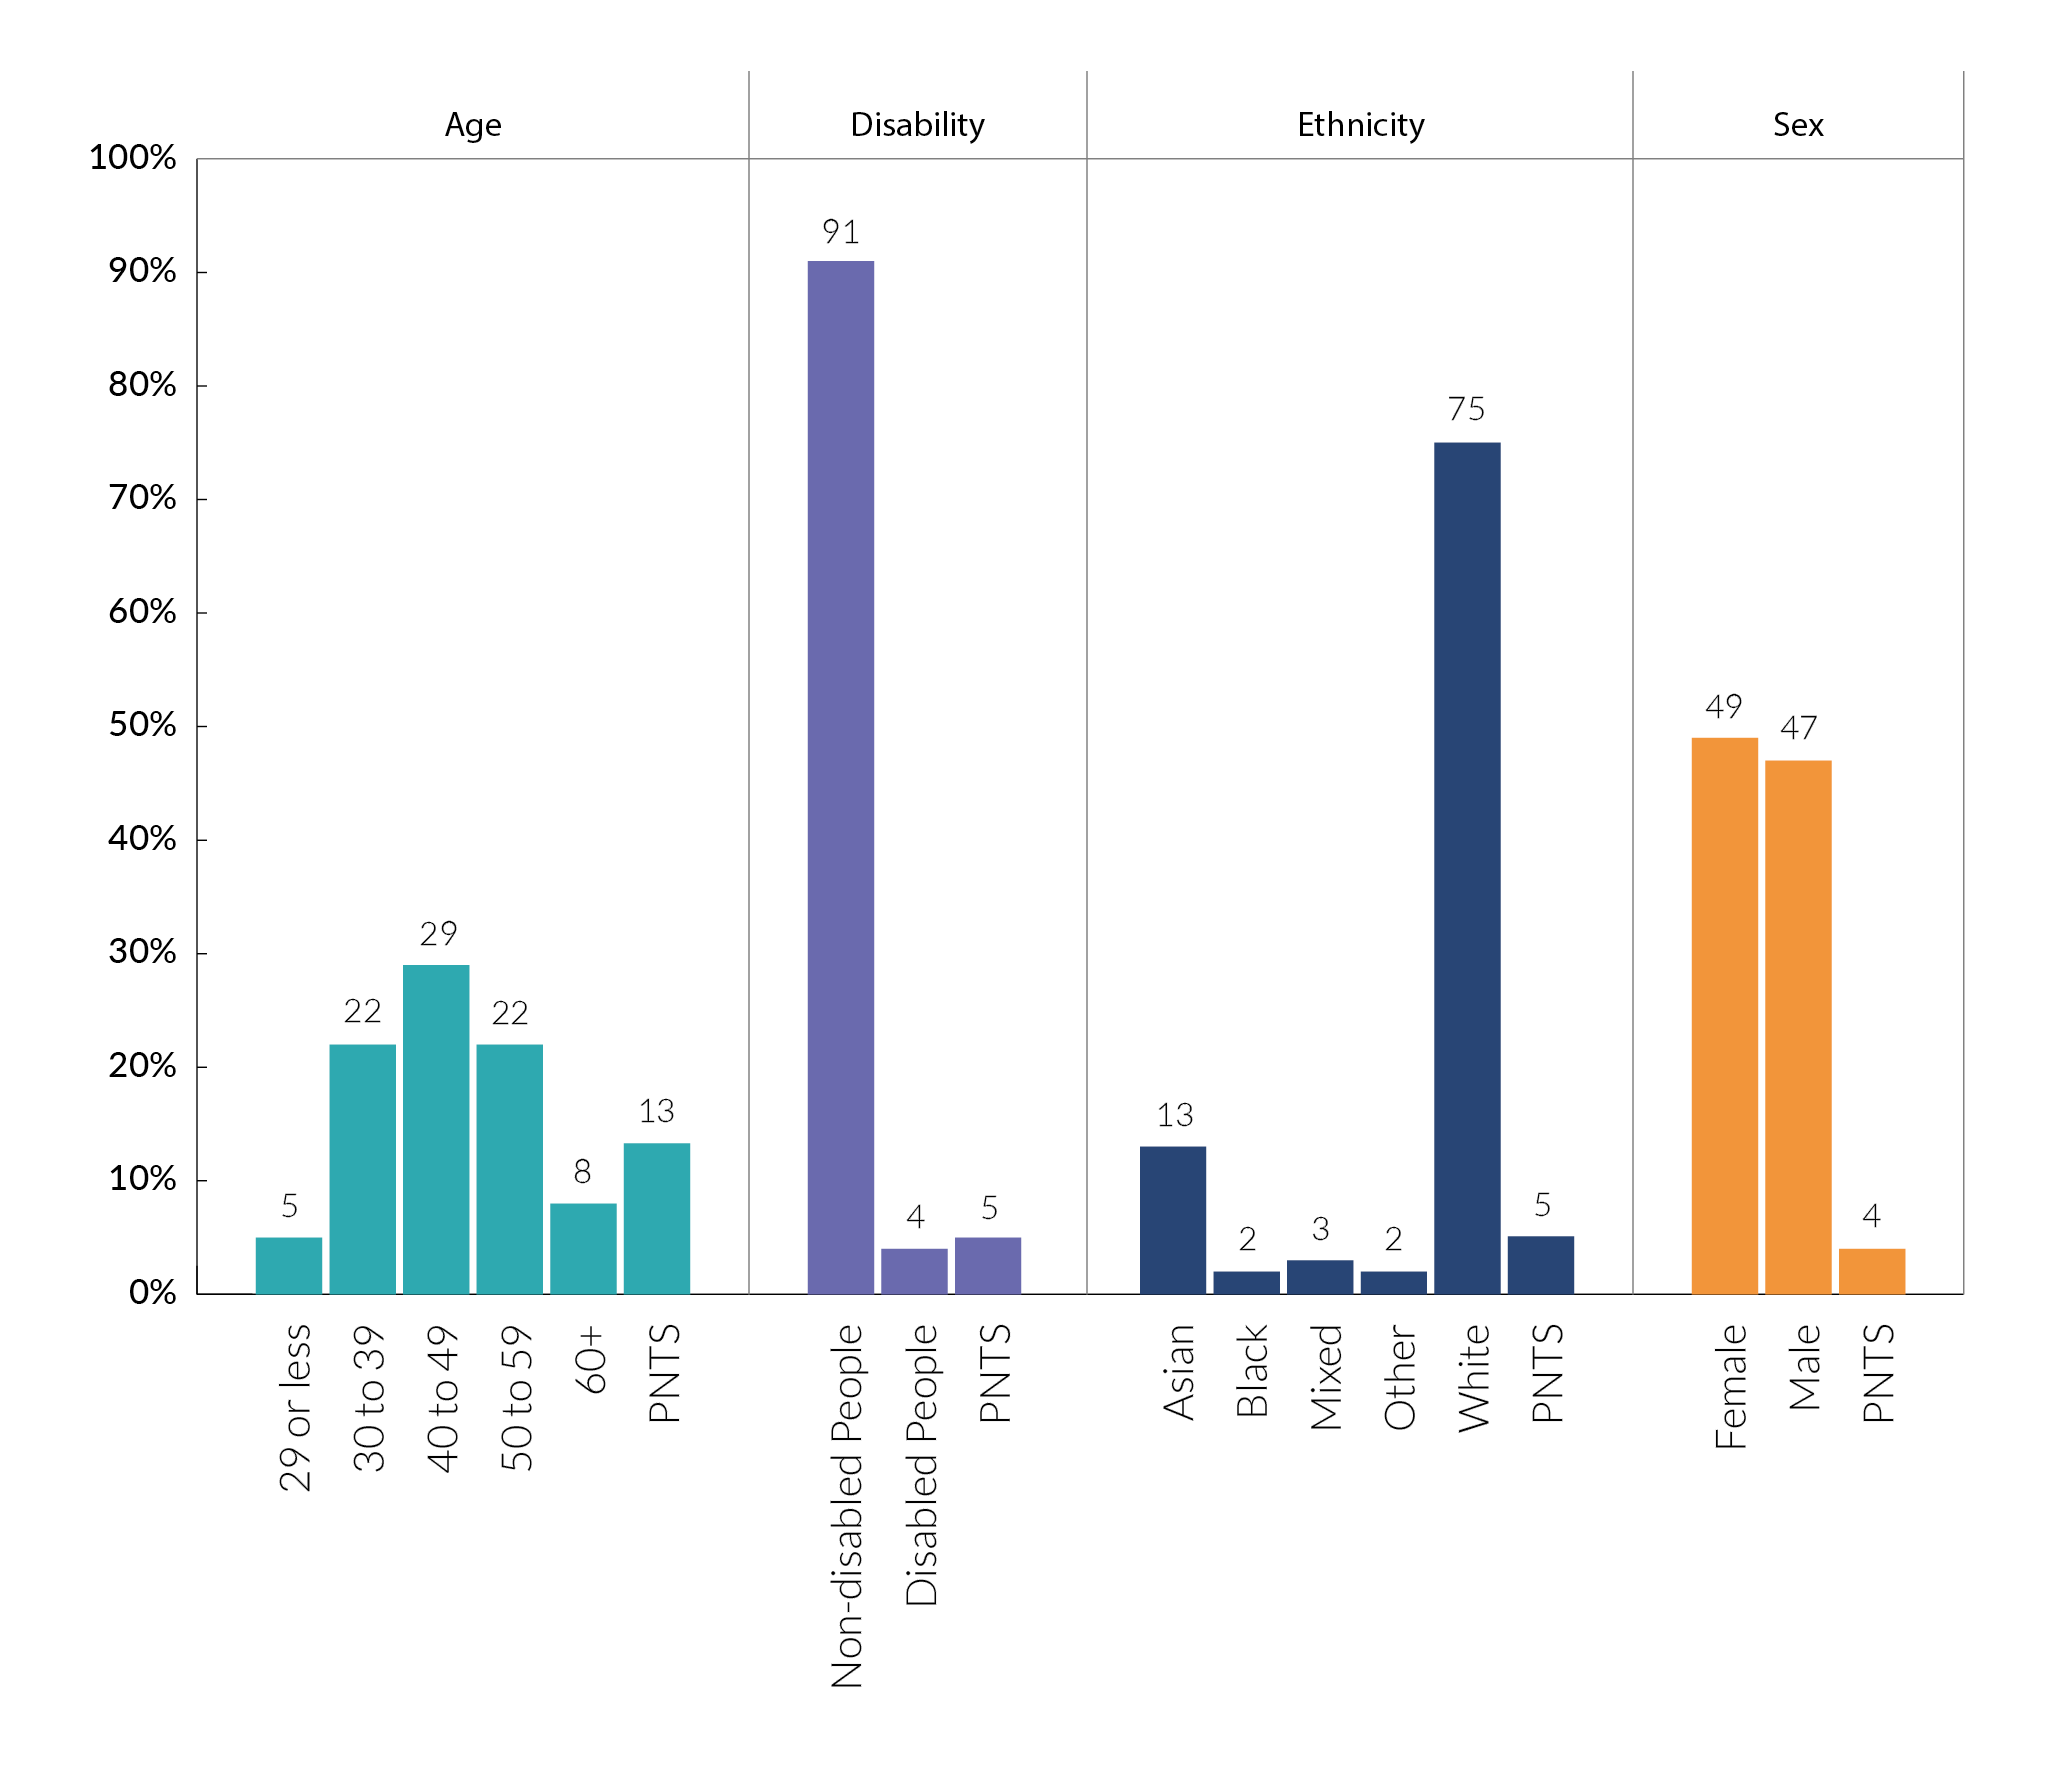
- The average age of all of our applicants is 46 years old.
- The proportion of applicants who declare a disability (4.2%) has increased from 3.5% in 2021 to 4.2%. This is similar to the HESA data (4.9%).
- The proportion of applicants from Asian, Black, Mixed, Other and White ethnic groups is broadly in line with the HESA staff data.
- 49% of all applicants are female, which is lower than the HESA staff data (53%).
Chart 2. Total amount applied for by geographical location
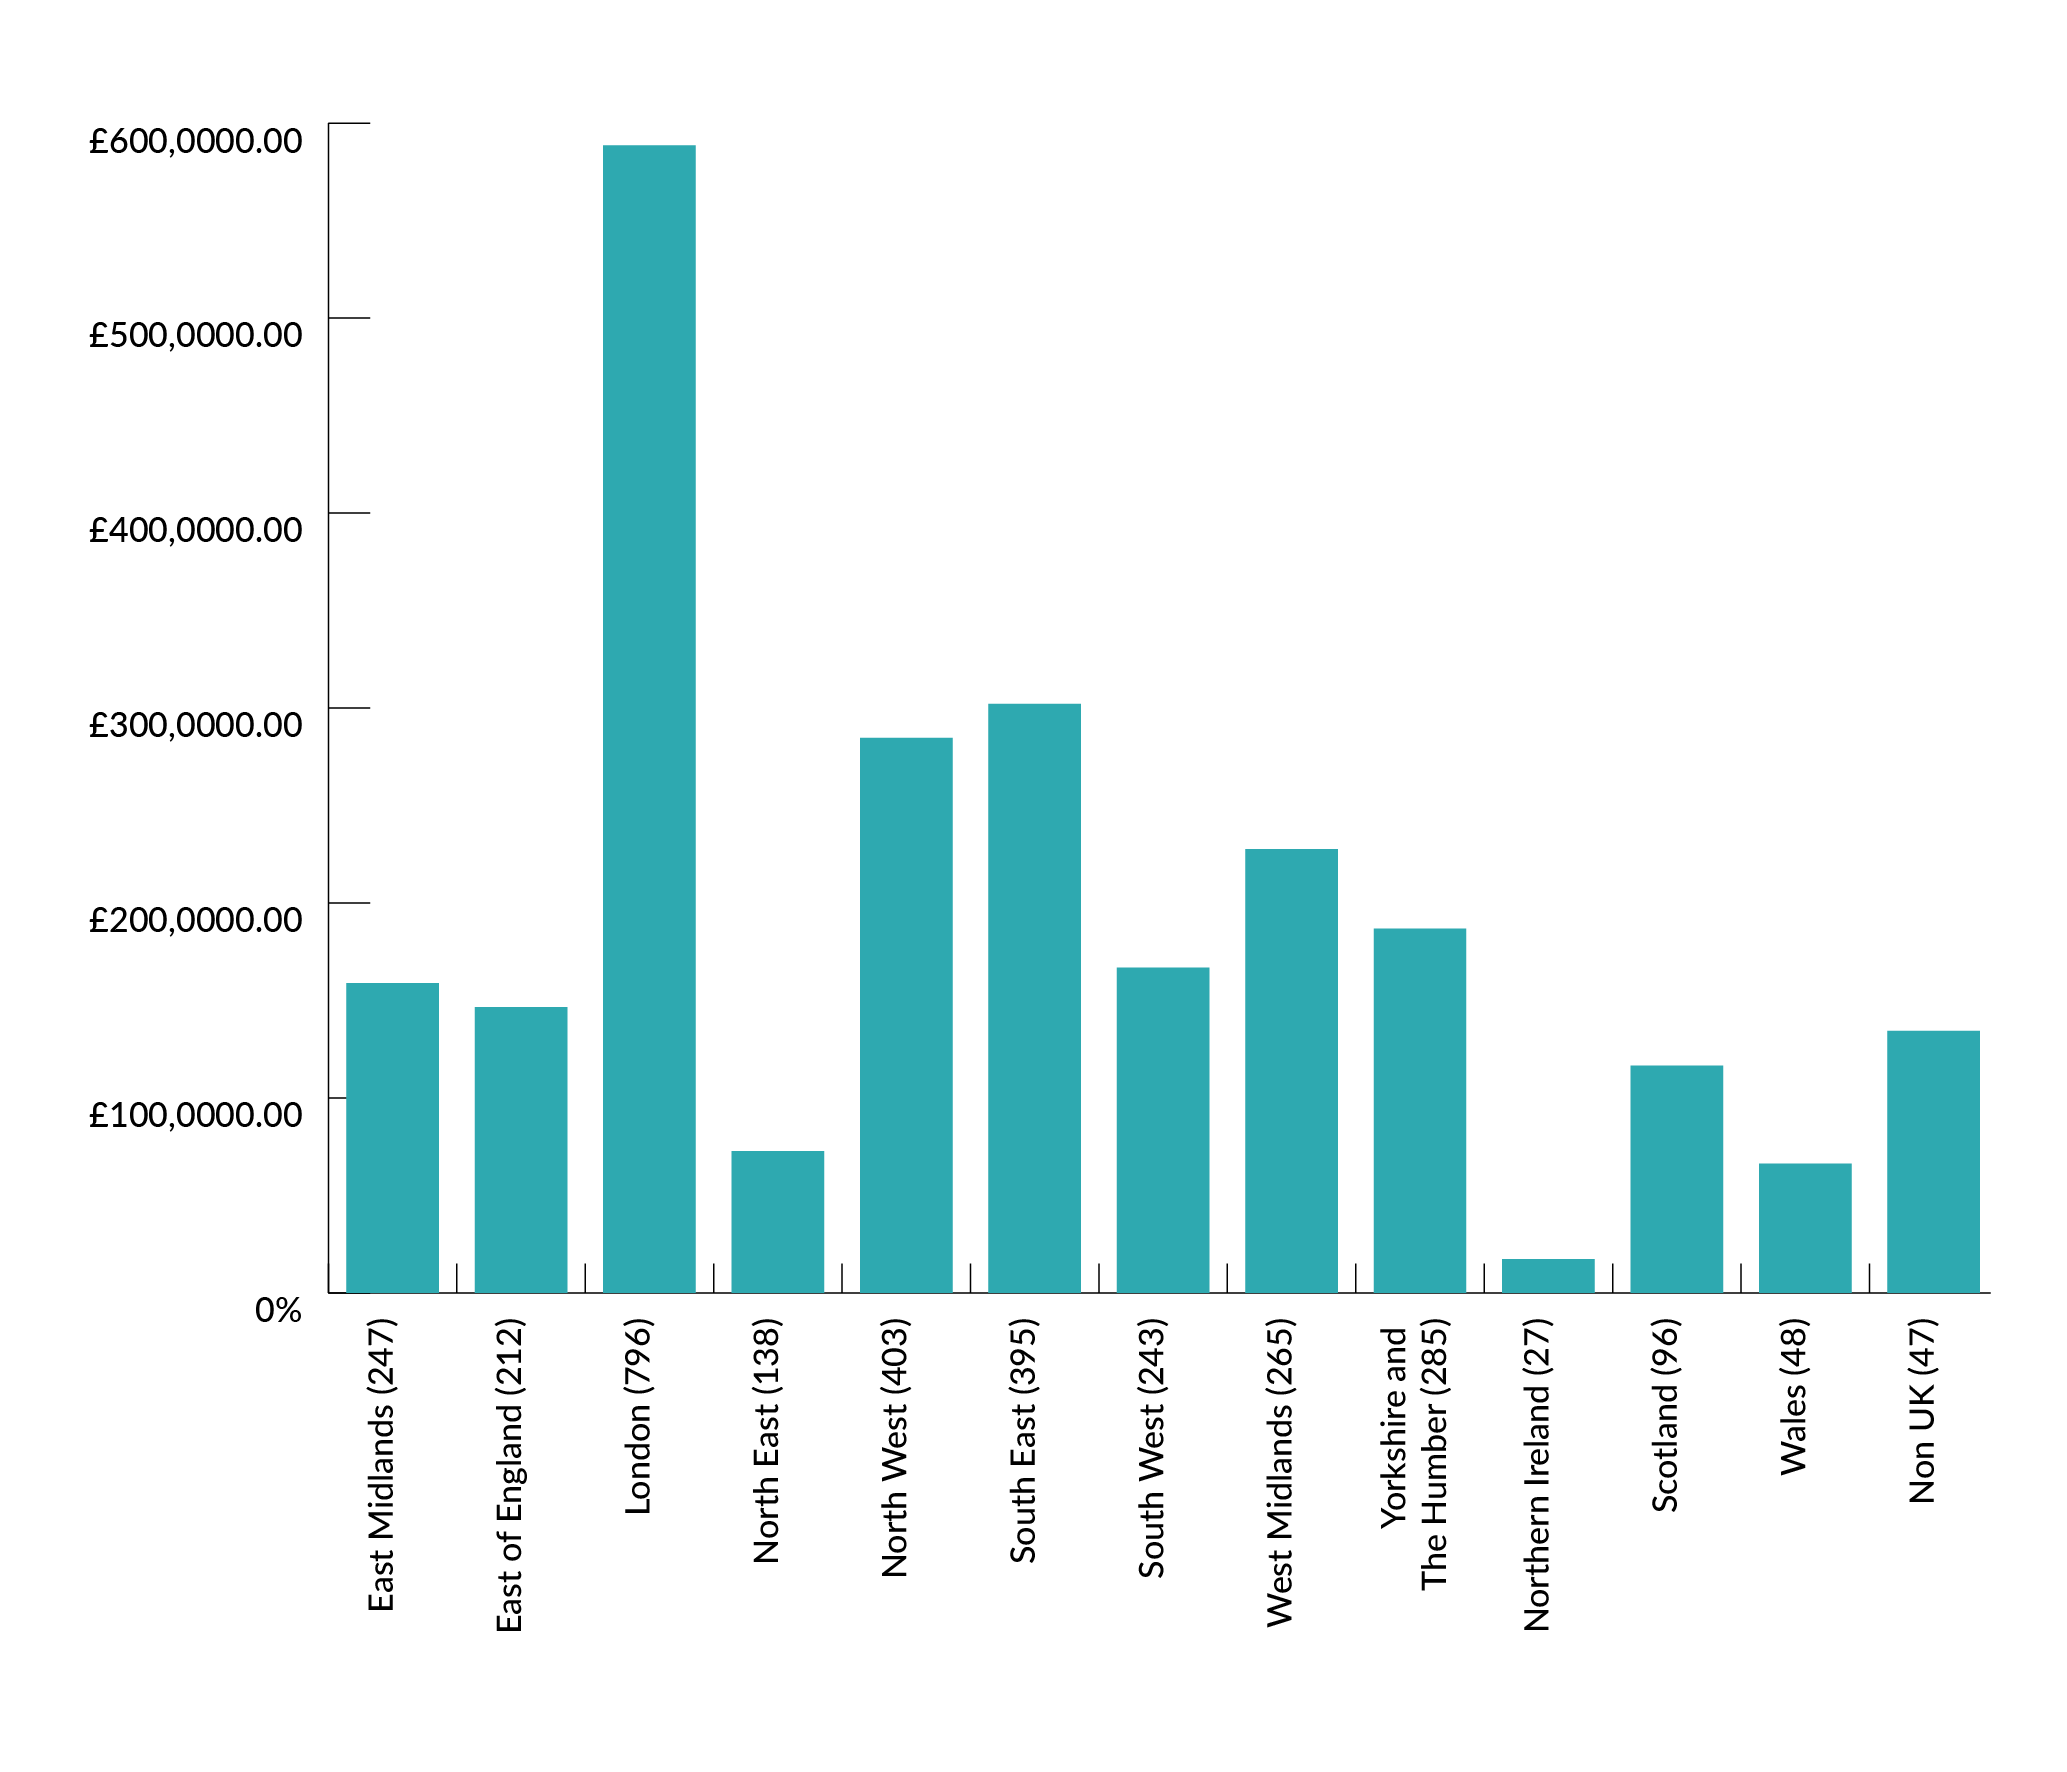
Regional breakdowns
- The total annual funding applied for is highest in London.
Who receives NIHR funding?
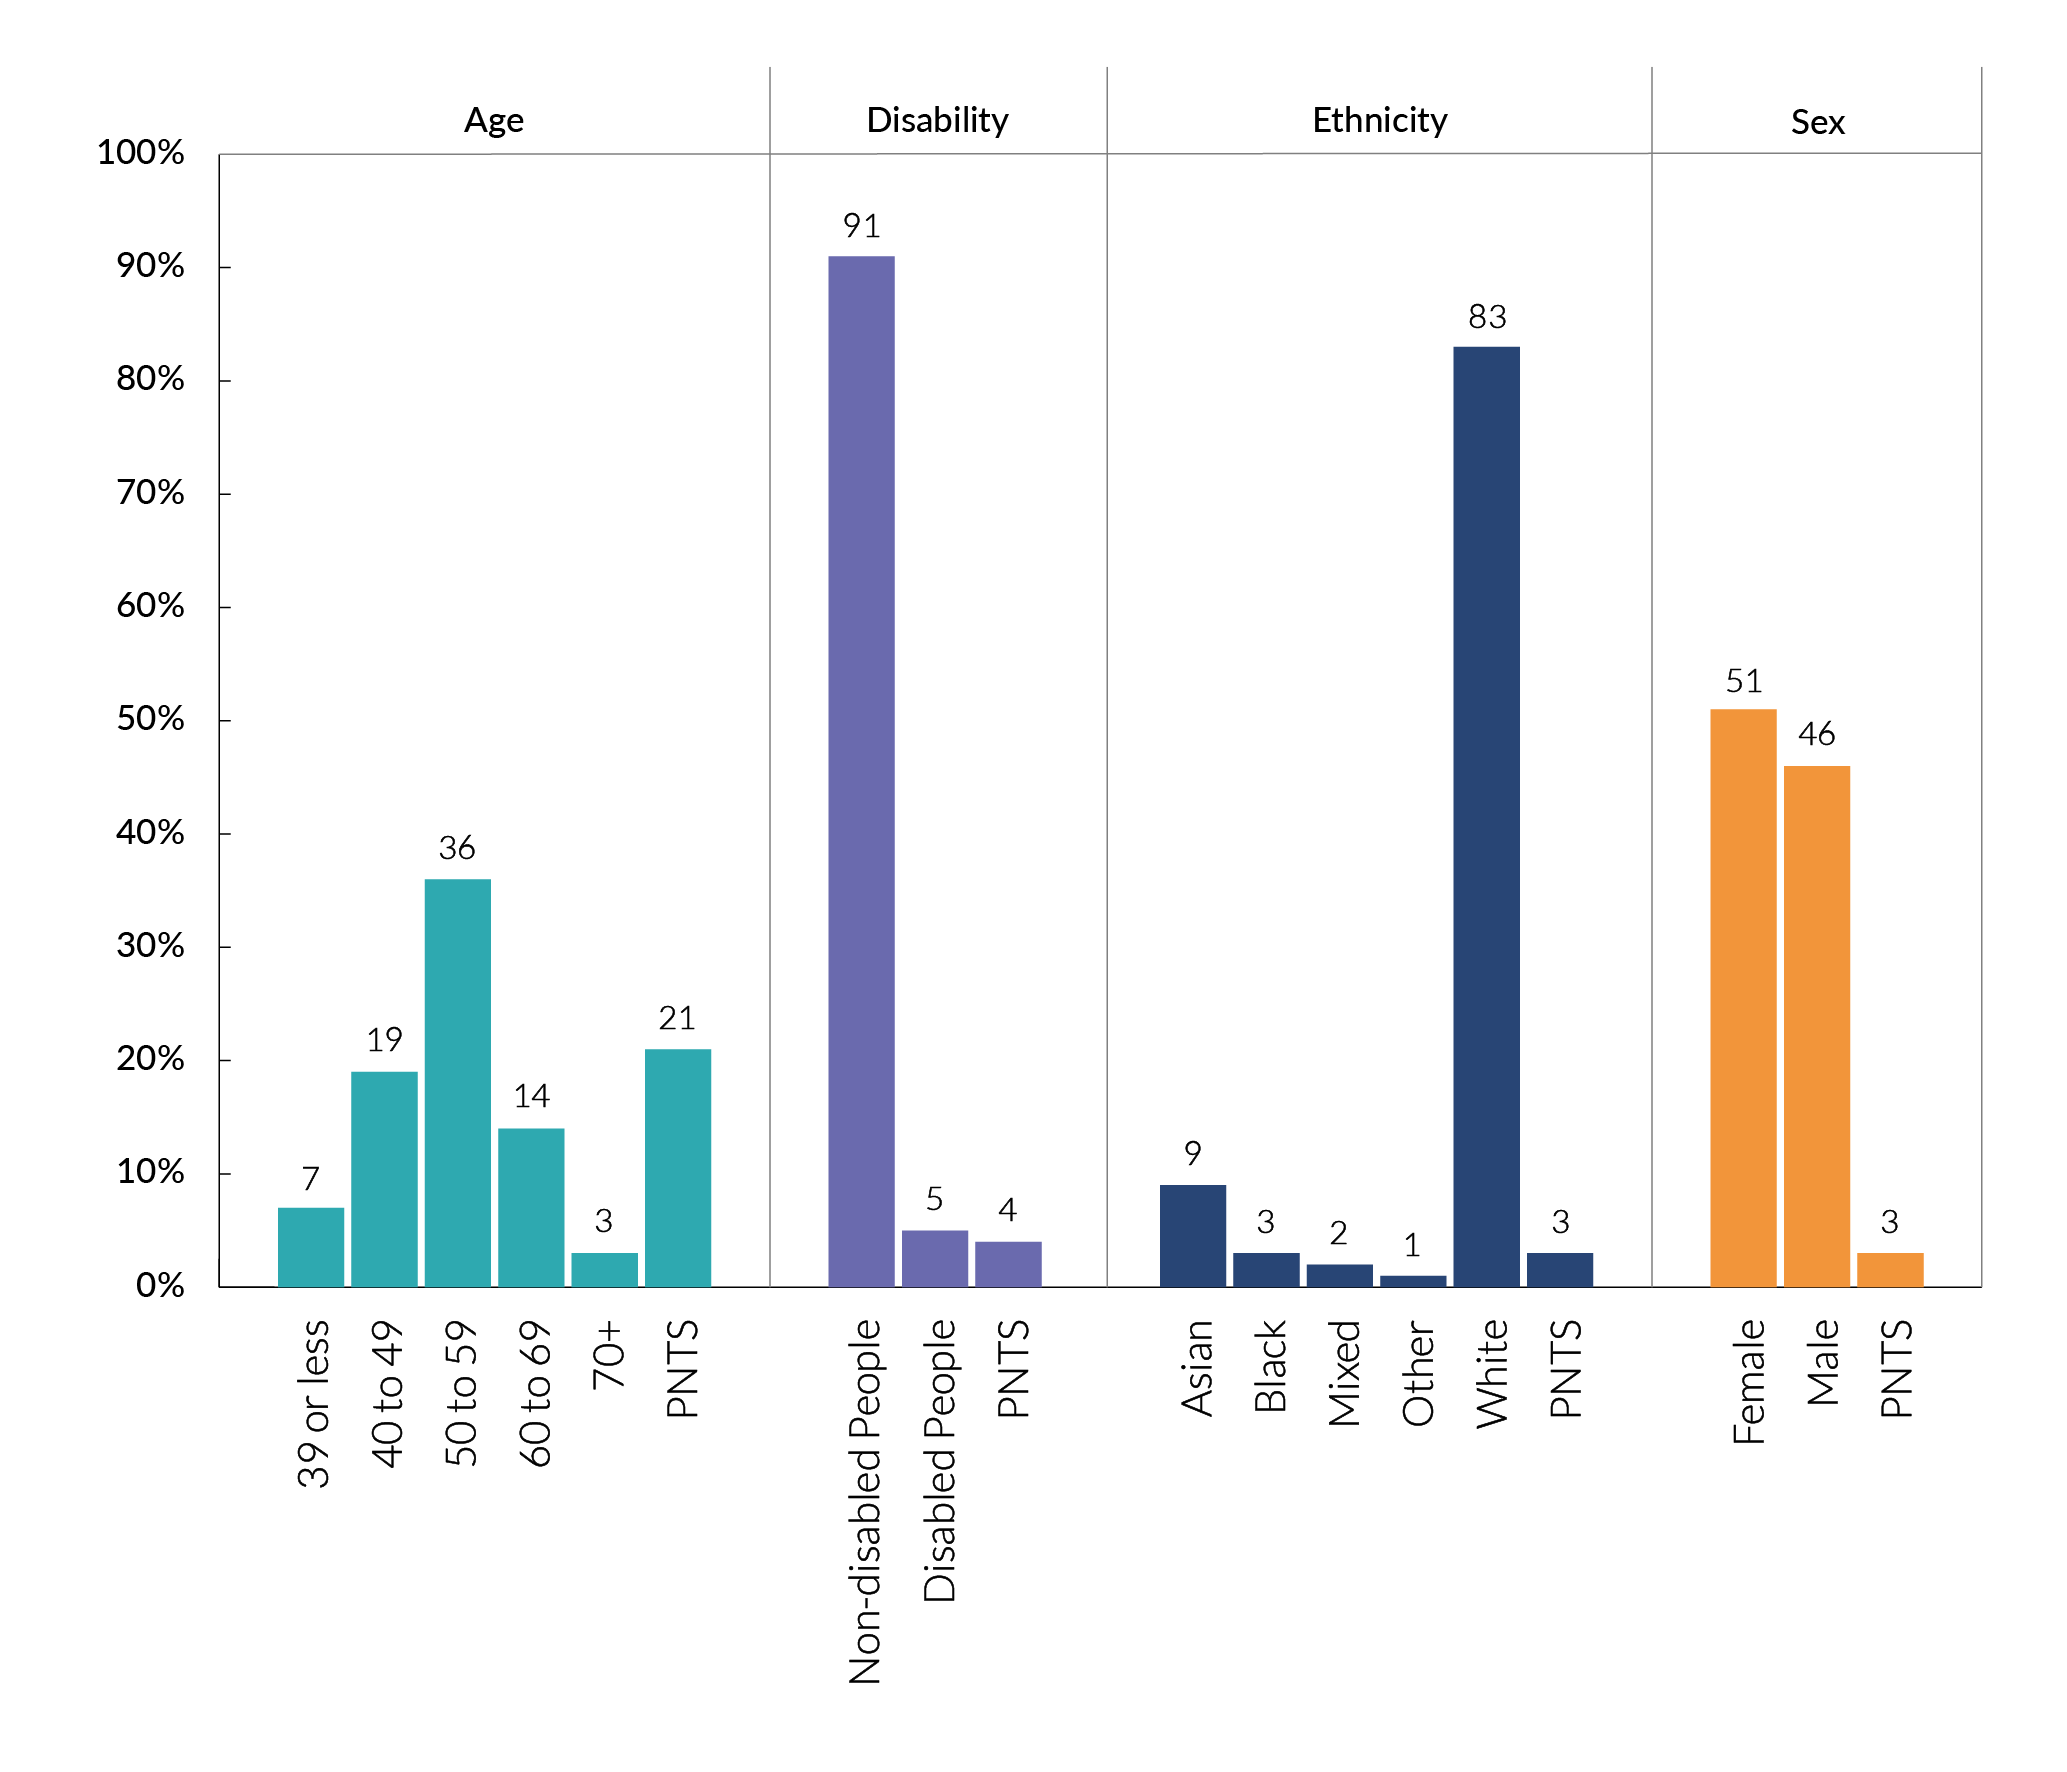
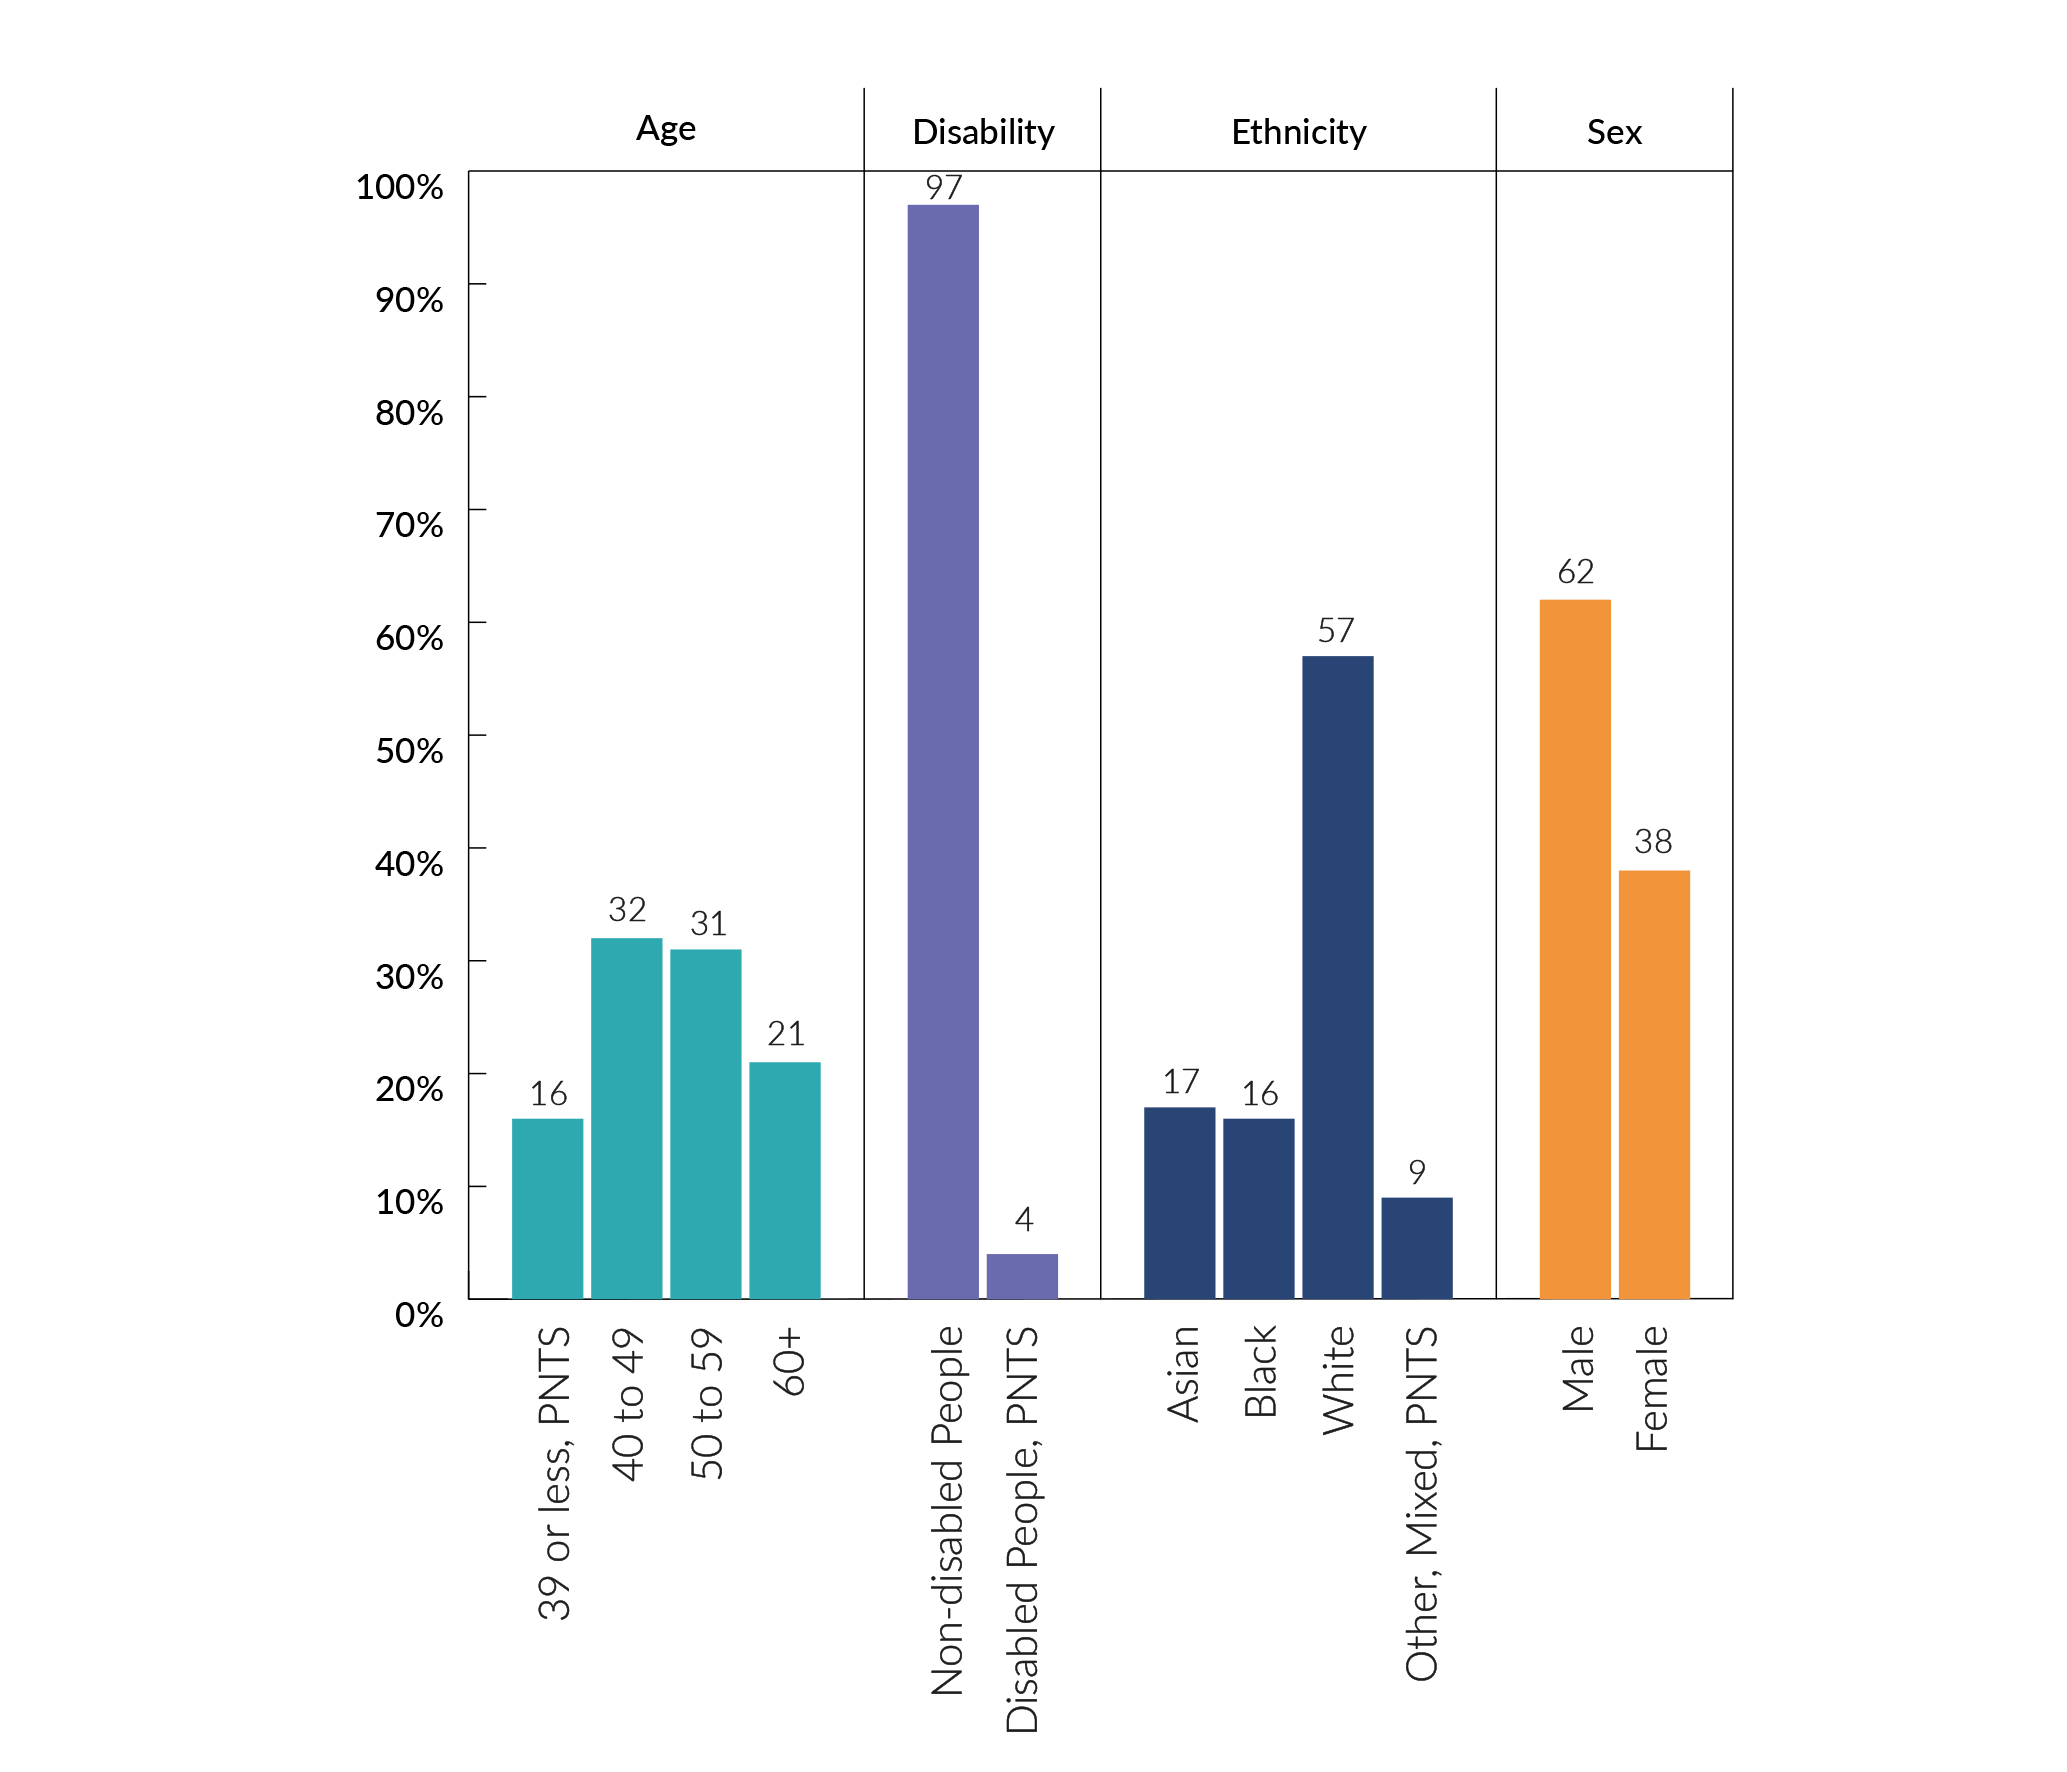
Chart 3. Who receives NIHR funding?
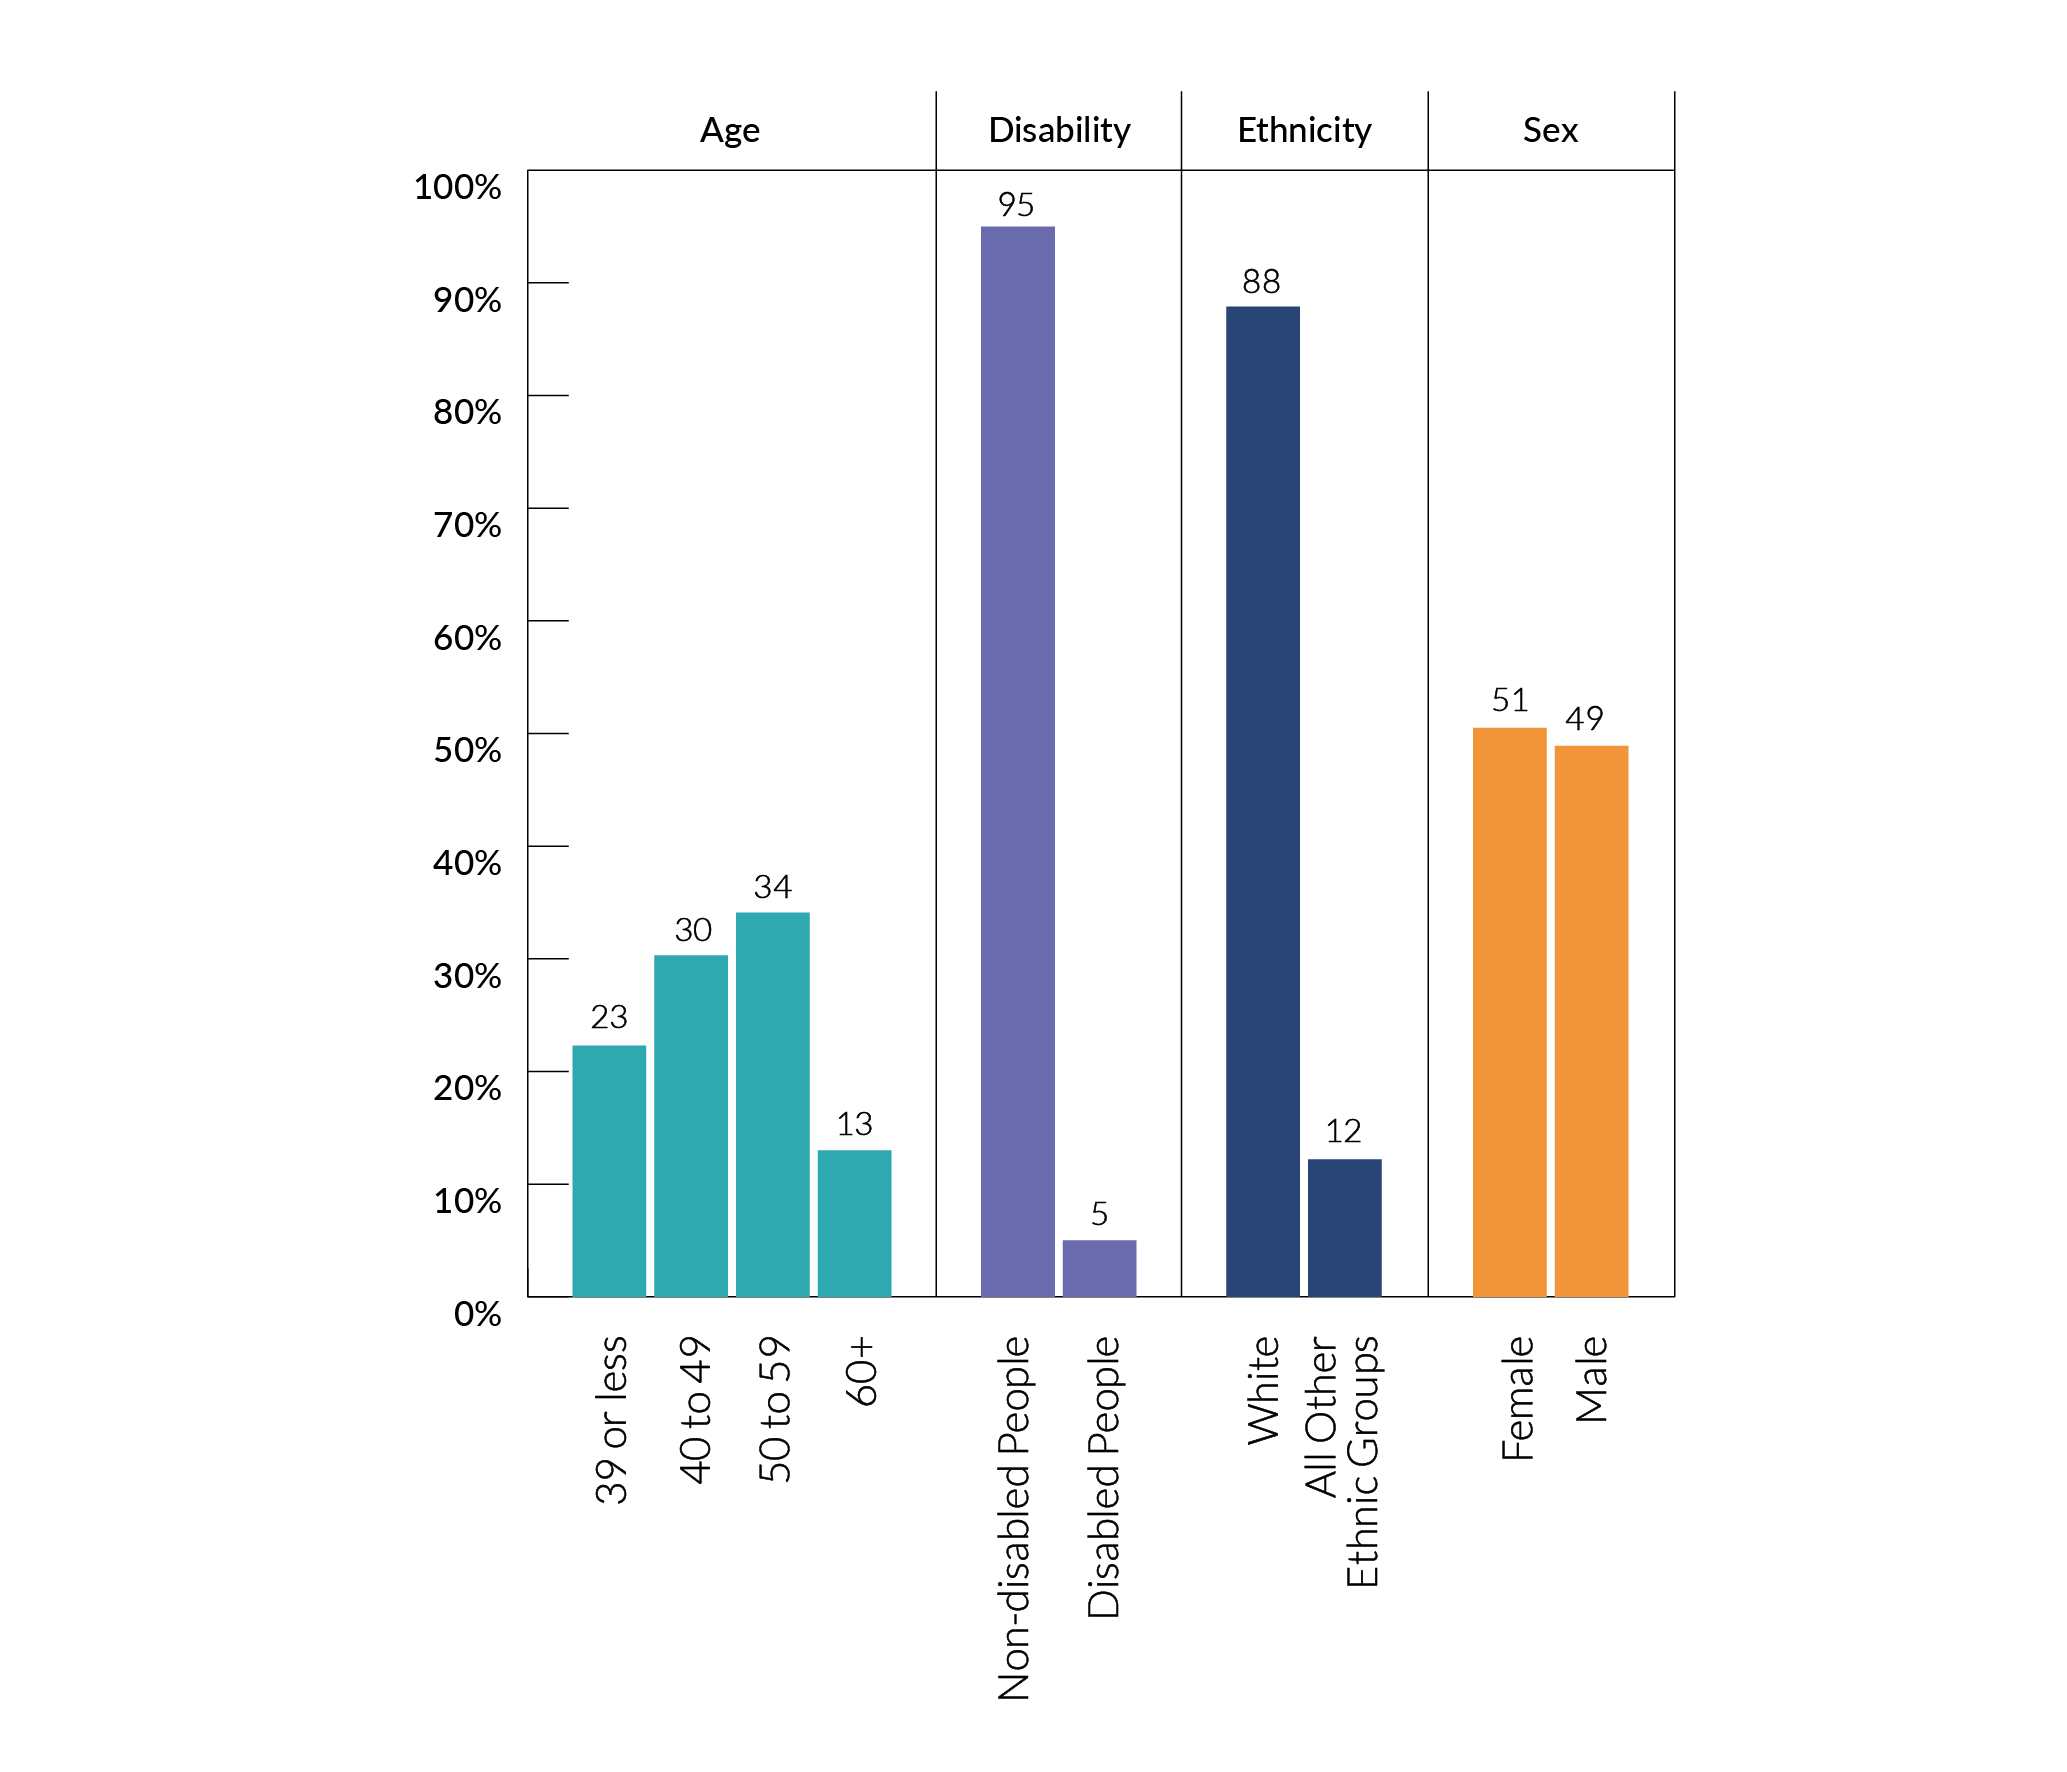
- The majority of successful funding applicants are between 40 and 59 years old (64%). The likelihood of funding success increases, from 23% in applicants who are younger than 39 to 13% in applicants aged over 60.
- 5% of successful applicants declared a disability. This is in line with HESA staff data (4.9%). People who declare a disability were successful in their applications at a similar rate (19%) to people who did not declare a disability (21%)
- 12% of successful applicants are from ethnic minority background, 7% less than HESA staff data. Applicants from ethnic minority backgrounds are 9% less likely to be successful in their applications.
- The proportion of females (51%) and males (49%) awarded funding is very similar overall. Women are 2% more likely to be funded than males, due to making fewer applications.
Who are our award holders?
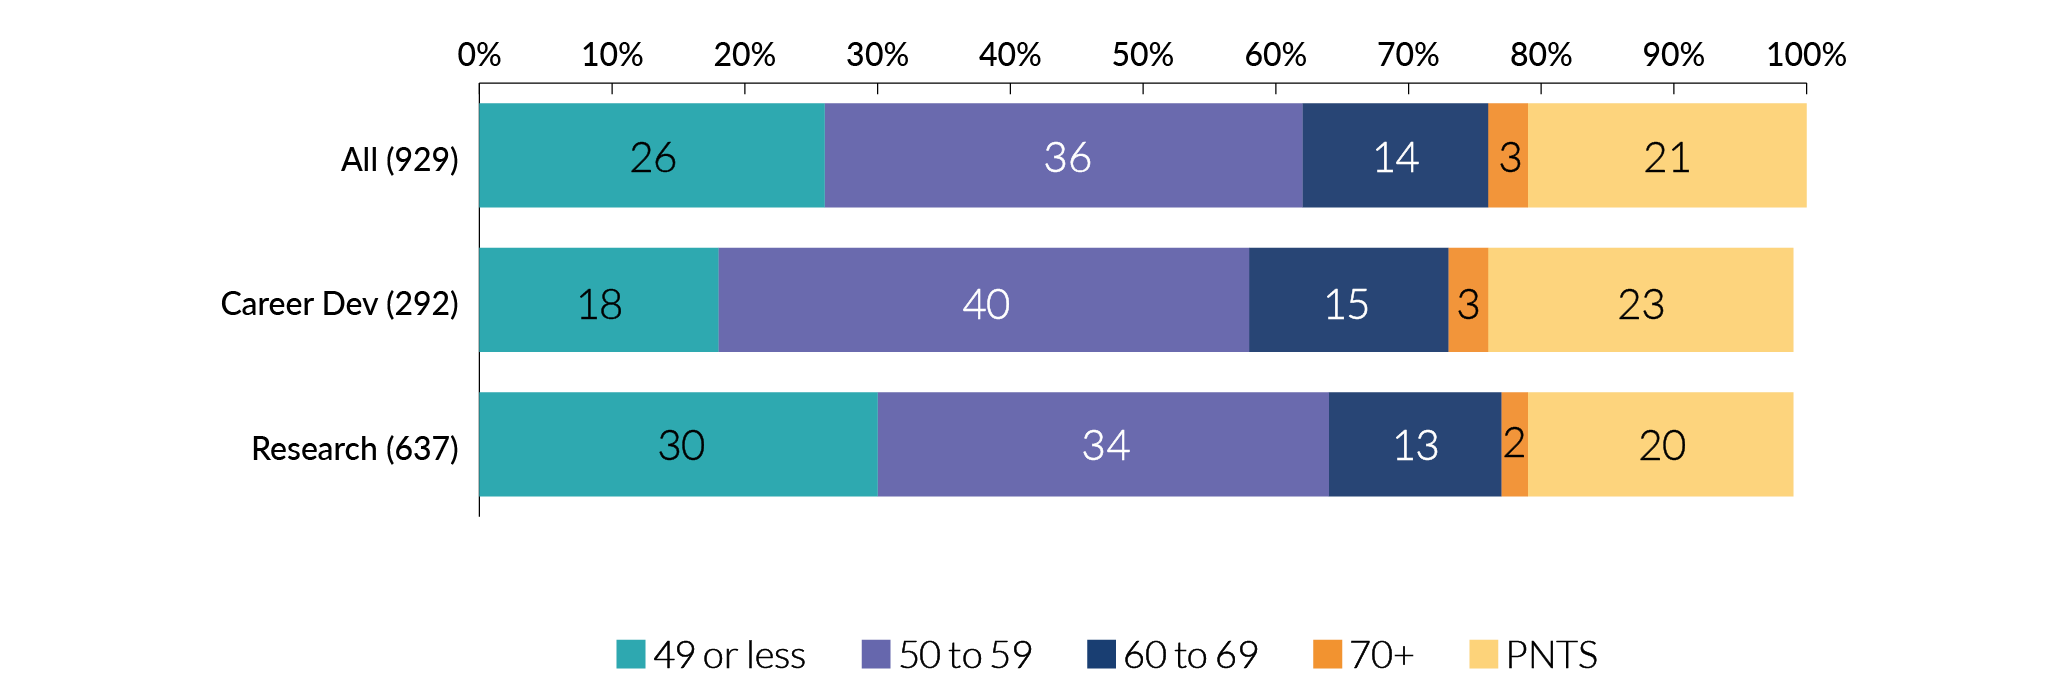
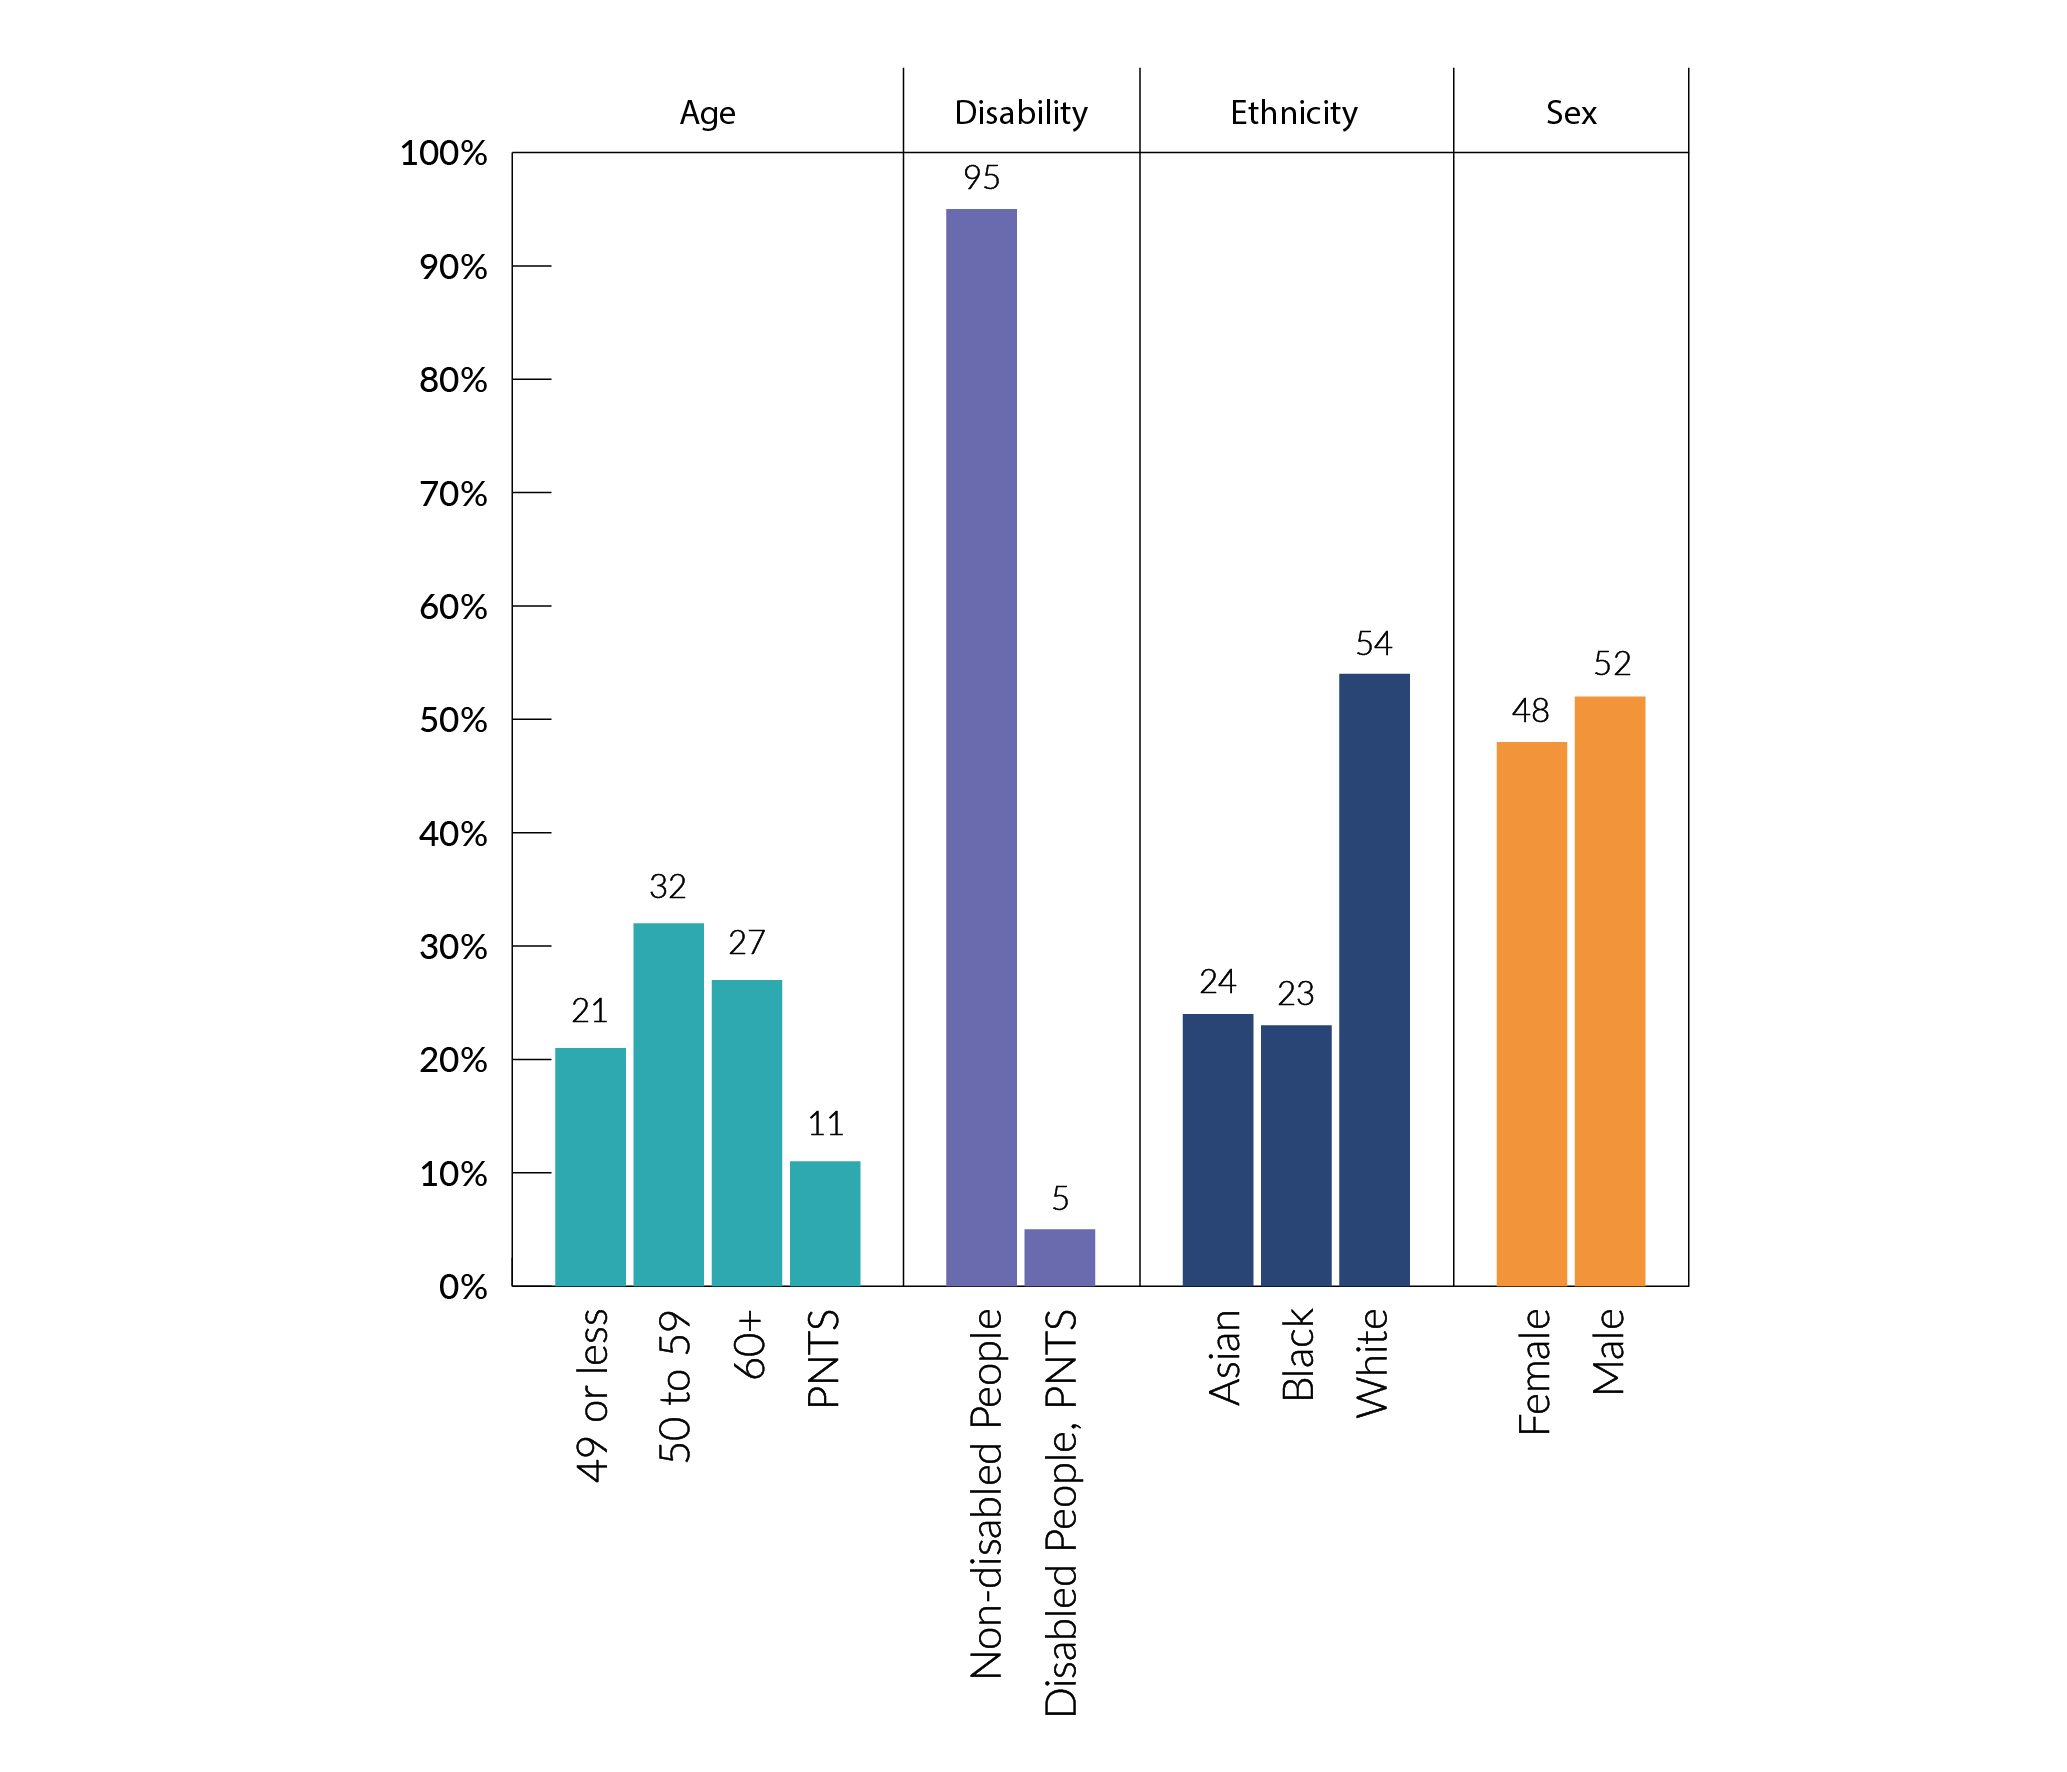
Chart 4. Who are our award holders?
- Award holders are 48 years old on average, 3 years older than applicants. However as with applicants there is a large proportion of ‘prefer not to say’ responses.
- 3% of award holders declared having a disability, this is consistent across career development and research programmes, and is lower than the number of HESA staff that declare having a disability (5%)
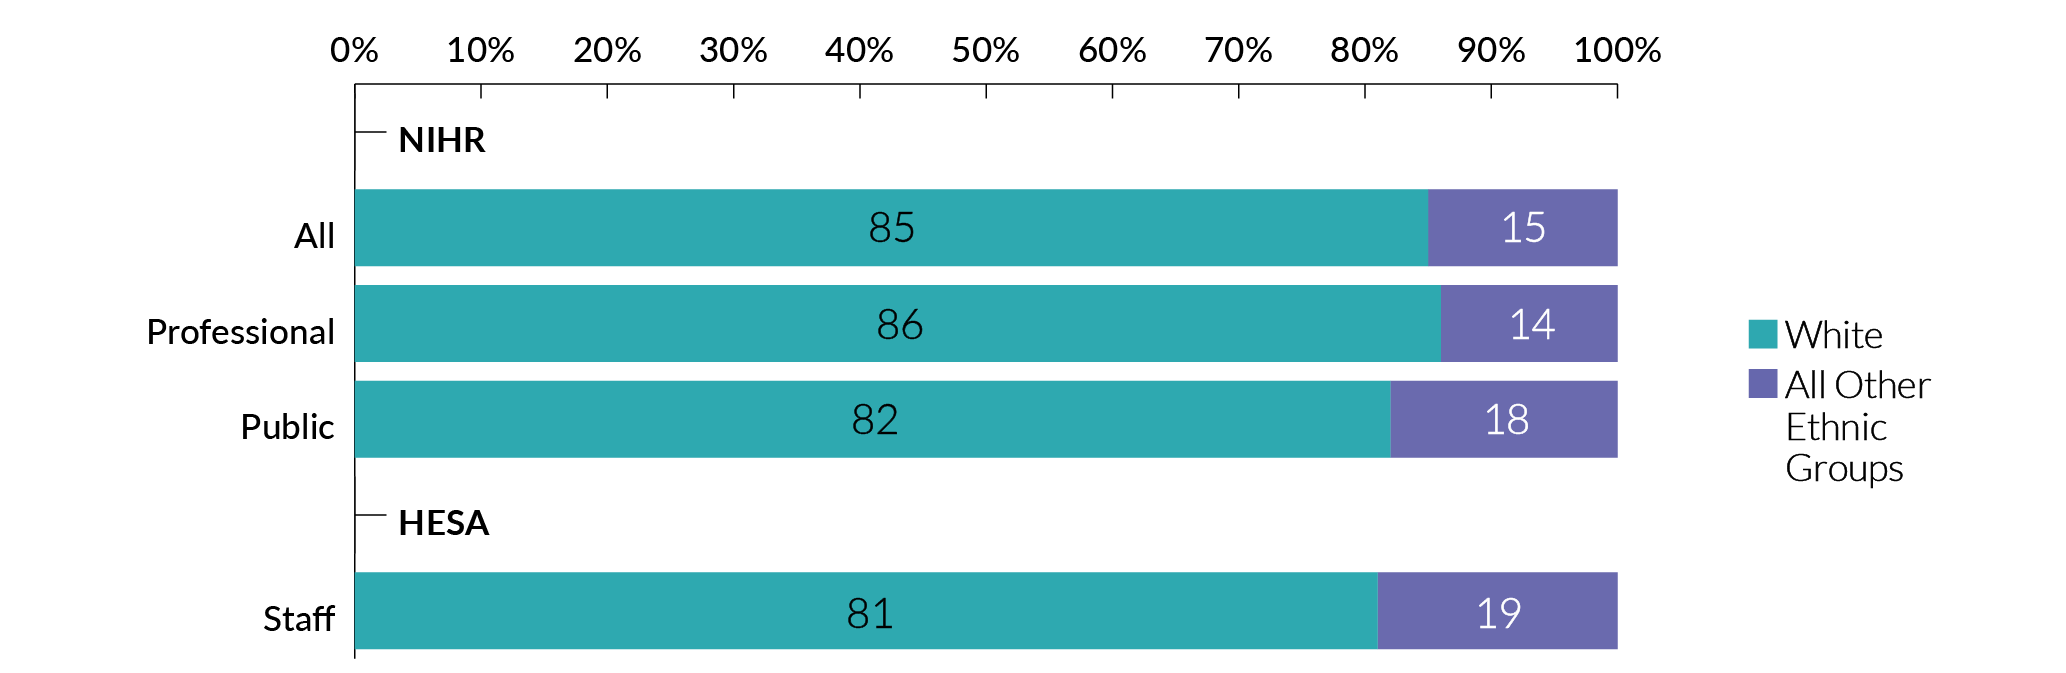
- 14-16% of NIHR award holders are from an ethnic minority background. The proportion of award holders from Black and Other ethnic groups are slightly lower than the HESA staff data. The proportion of award holders from Asian and Mixed groups are similar to the
HESA data. - There is a higher proportion (6%) of female award holders than male.
Who sits on our selection committees?
Chart 5. Who are our committee members?
- Our committee members tend to be older than our applicants and award holders. Public members (61 years old) are on average 9 years older than professional members (52 years old).
- Only 3% of professional committee members declared a disability, this is 2% lower than the proportion of HESA staff that declared a disability.
- 30% of our public committee members declared a disability.
- People from an ethnic minority background are under-represented on career development programme committees (9%).
- Overall our committees have higher representation of females than males.
Global Health highlights
- Global health applicants, award holders and committee members have an older age profile than applicants to UK programmes.
- Due to their small numbers, responses for ‘prefer not to say’ and those who declared a disability had to be combined. This makes it difficult to comment on trends. However, the proportion of people who declared no disability is lower than last year.
- There is a higher proportion of applicants that identified as being from Asian, Black, Mixed and Other ethnicities compared to our UK programmes.
- The White ethnicity group continues to have the largest proportion of applicants, award holders and committee members.
- The proportion of respondents selecting the ‘prefer not to say’ option for ethnicity has reduced since last year.
- Female applicants have increased by 22%, and female committee members have increased by 4% since last year. However, female award holders have decreased since last year.
Applications for funding
1.1 Age
Chart 6. Age of our applicants by programme type
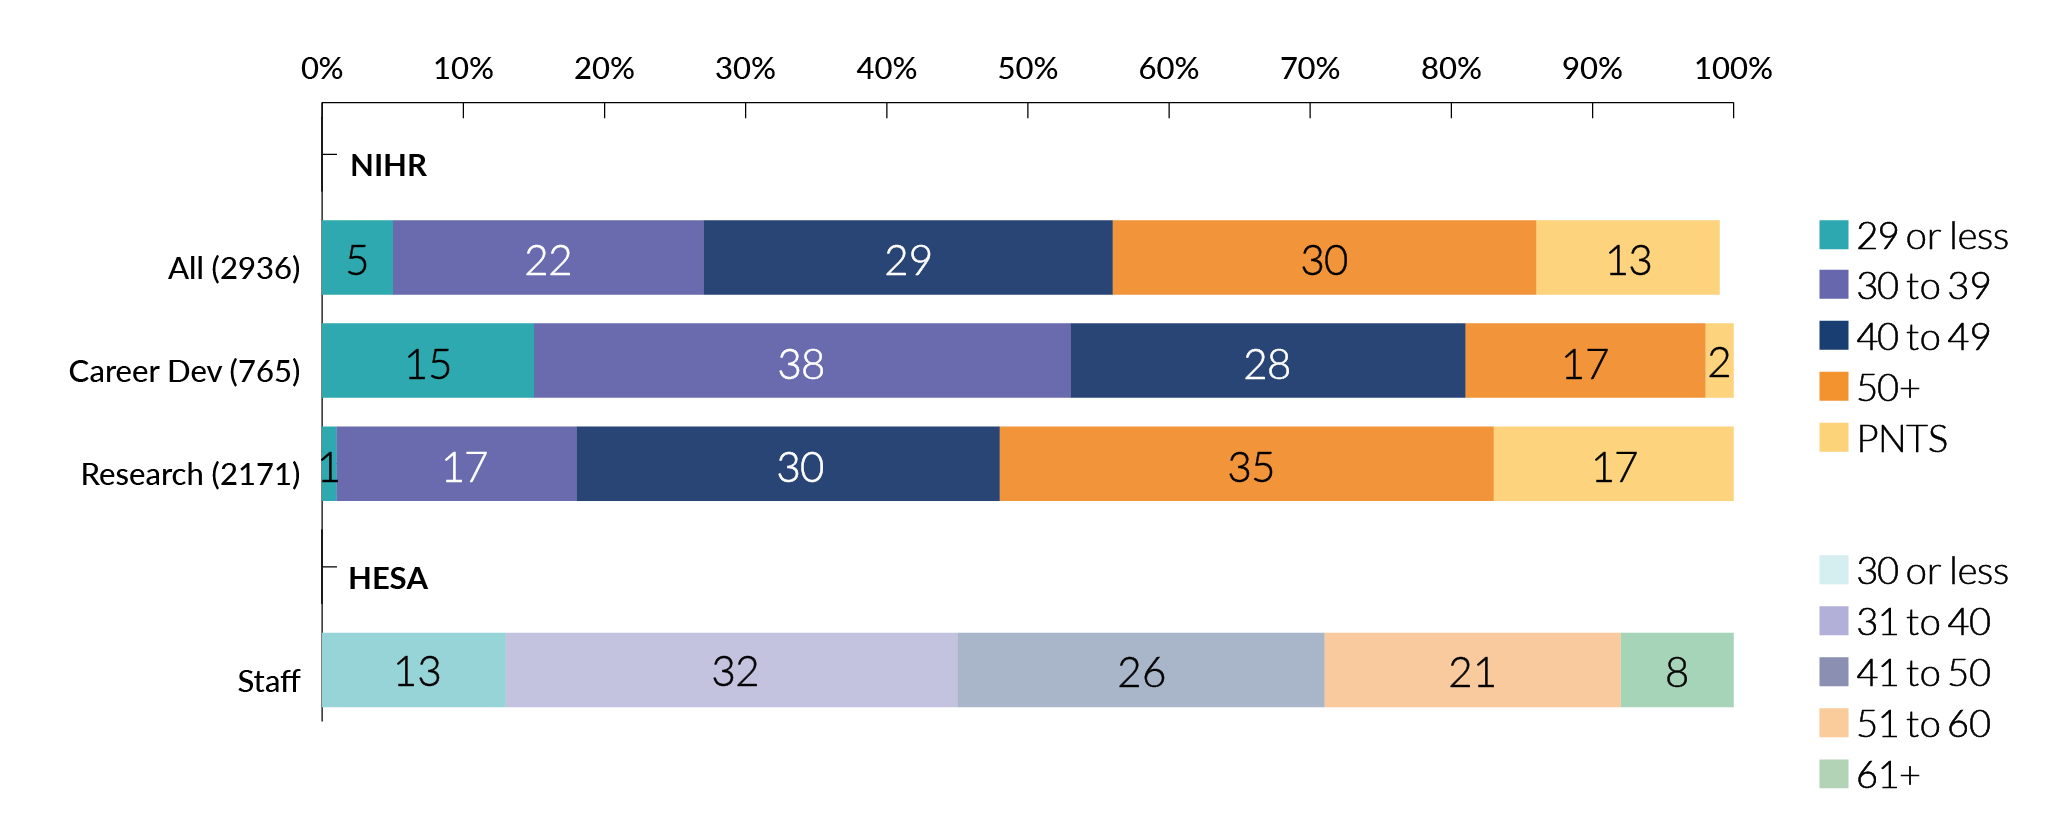
Programme type
- Across all programmes, approximately 60% applicants are from the 40-49 or 50+ age groups.
- Age groups (29 or less and 30 to 39) are better represented in the career development programmes compared to research programmes. This is because many NIHR career development programmes are targeted at early career researchers, who are typically younger in age.
- Most applicants to research programmes are aged 40+.
Chart 7. Age of our applicants by career stage
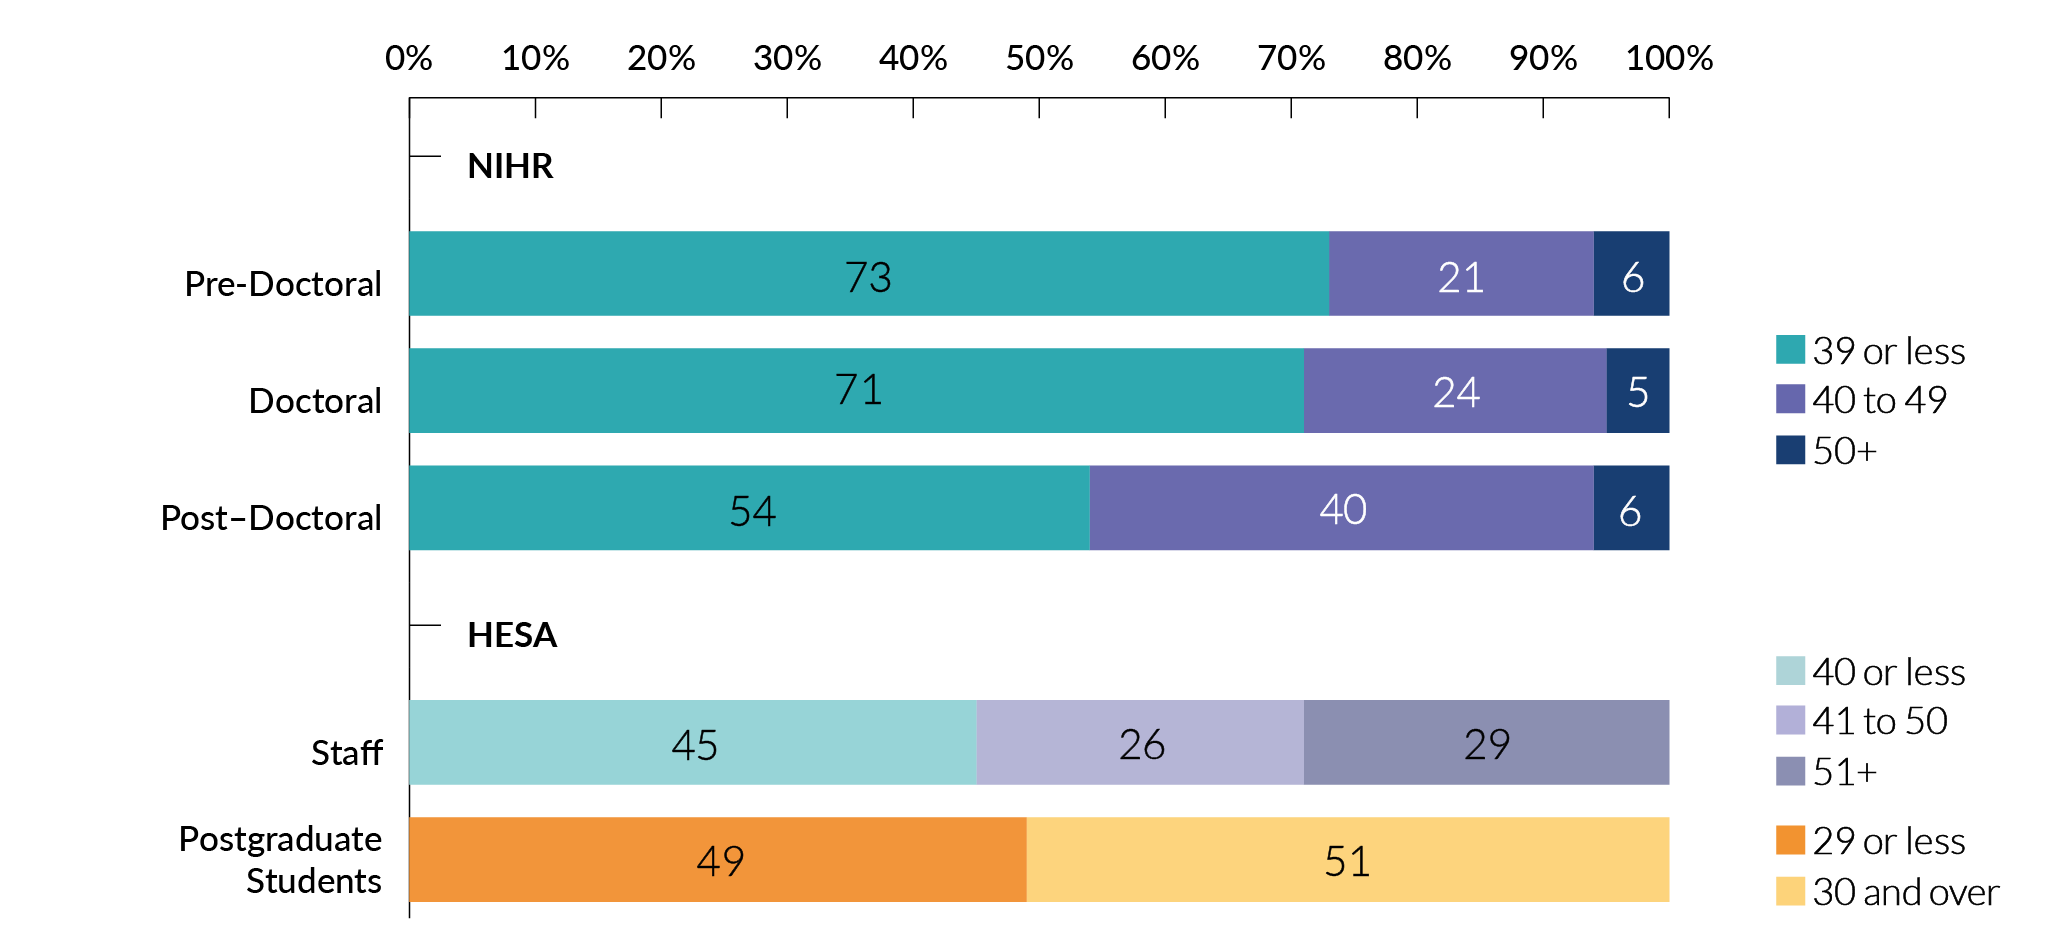
Career development programmes
- The majority of pre-doctoral- and doctoral-level career development programme applicants are aged 39 and under, whereas at the postdoctoral level, it is far more balanced, with 40.3% of applicants aged 40 to 49.
Chart 8. Amount applied for by age group
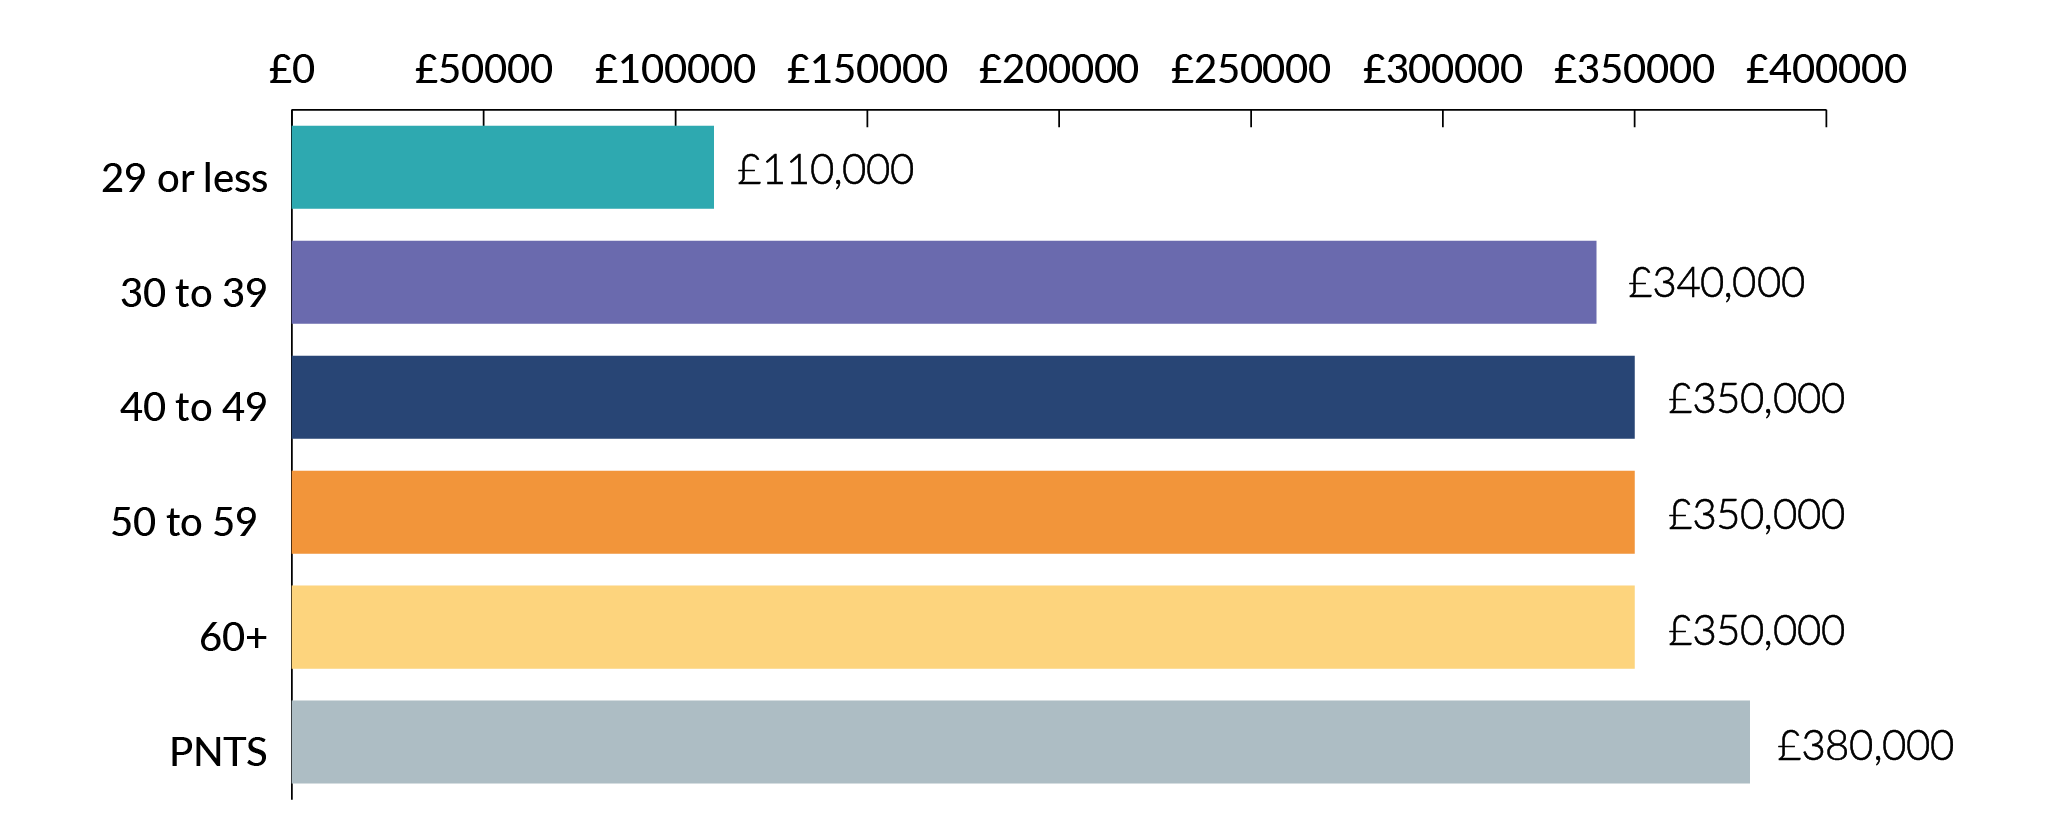
Application value
- Those aged 29 and under apply for £230,000 less than those aged 30-39. This is a reflection of the smaller award value available for pre-doctoral and doctoral funding programmes.
- The other age groups apply for similar amounts.
1.2 Disability
Chart 9. Disability status of our applicants by programme type
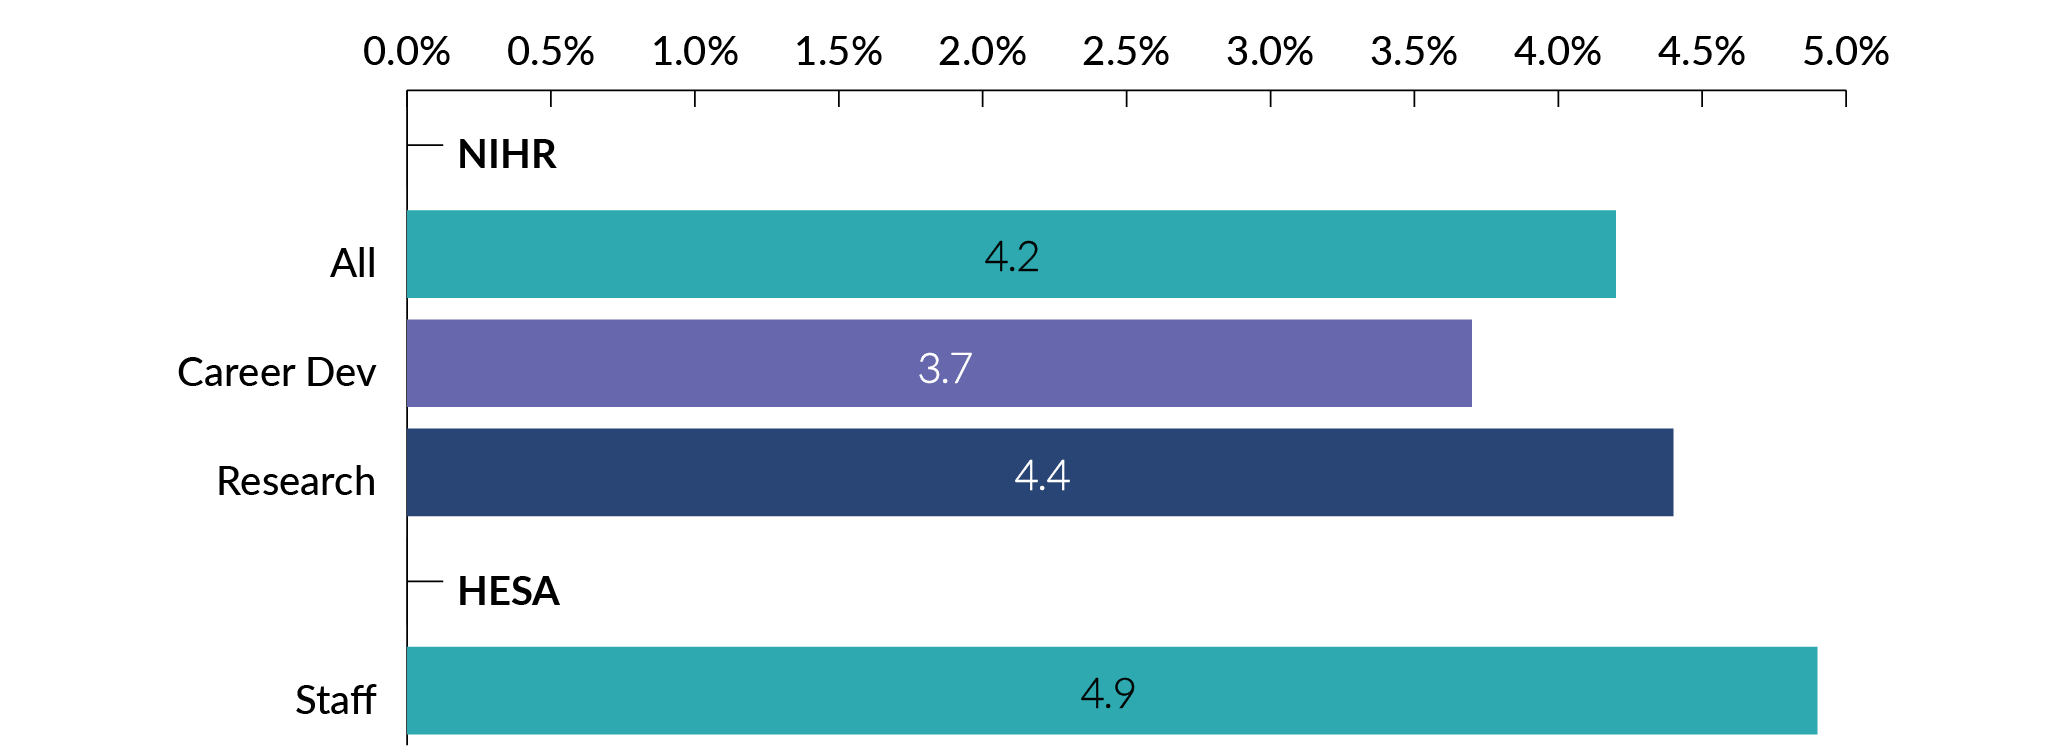
Programme type
- 4.2% of all applicants declared a disability, which is a slight improvement (0.7%) since last year. The proportion of applicants declaring a disability remains lower than HESA staff that declare a disability (4.9%).
- The proportion of applicants that declared a disability is lower for career development programmes (3.7%) compared to research programmes (4.4%).
Chart 10. Amount applied for by disability status
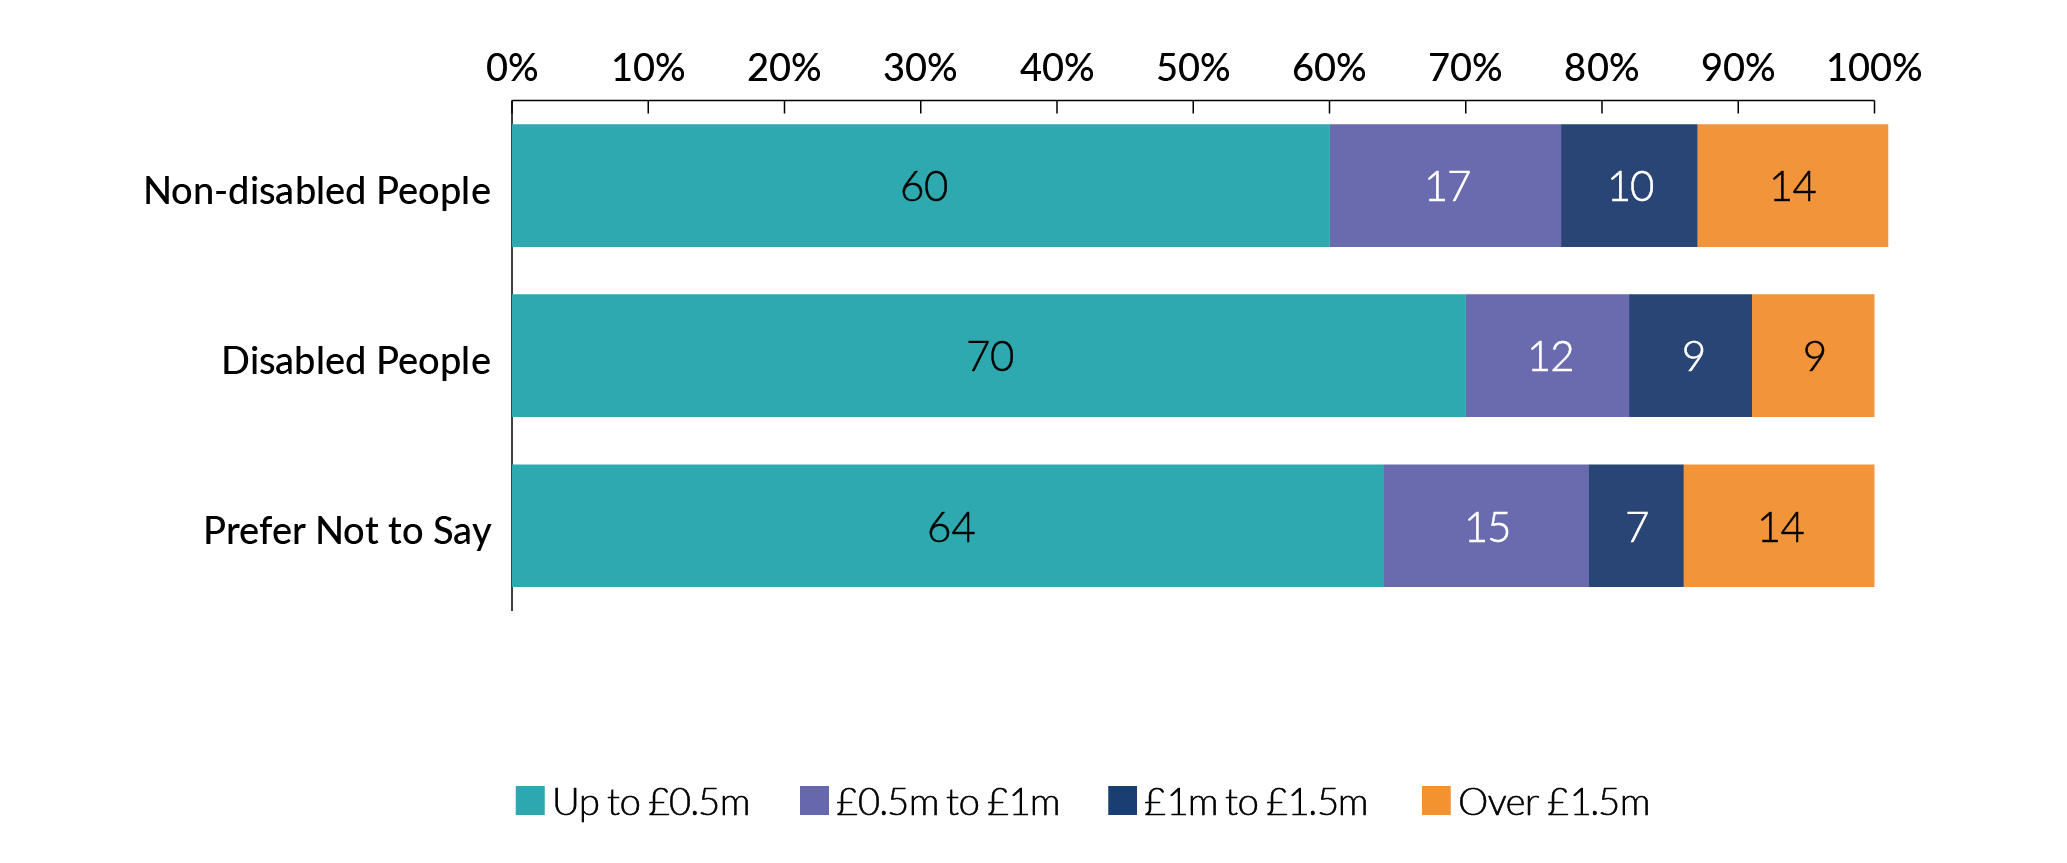
Application value
A larger proportion of applicants declaring a disability apply for grants less than £500,000. As a result, they apply for £70,000 less on average, than non-disabled applicants.
1.3 Ethnicity
Chart 11. Ethnicity of our applicants by programme type
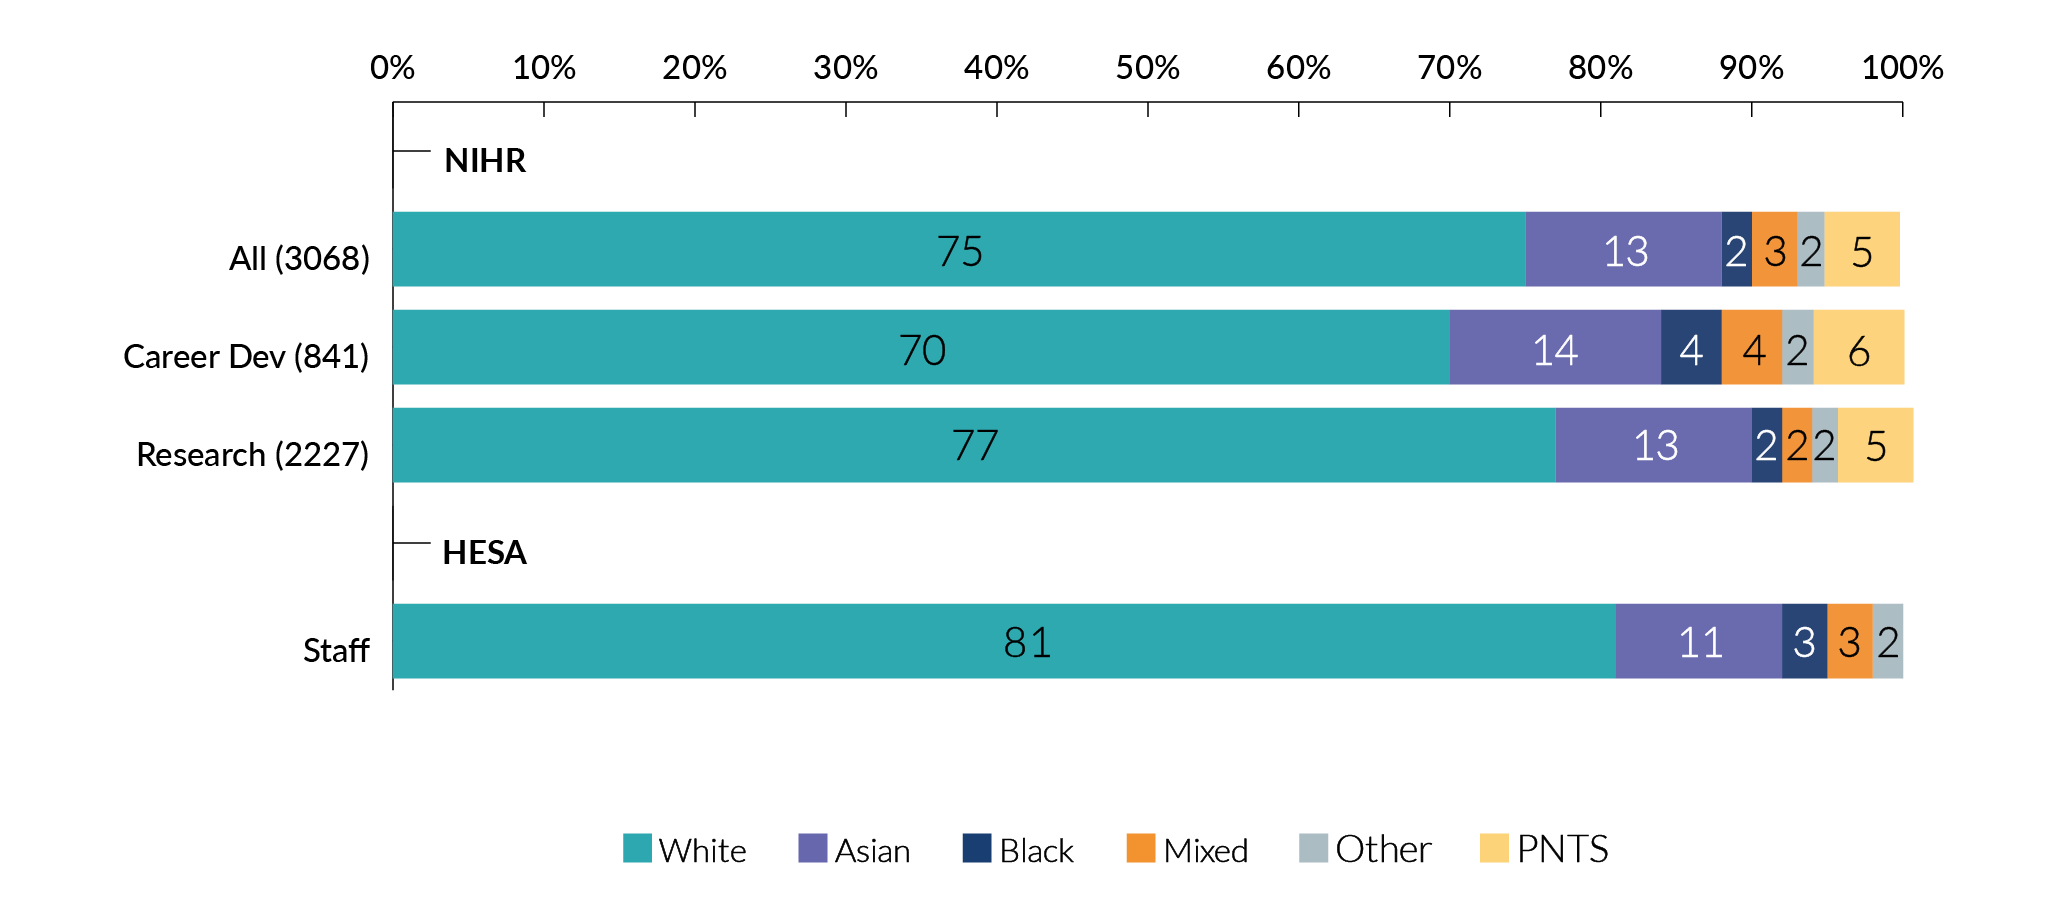
Programme type
- 24% of applicants for career development funding are from an ethnic minority background. When looking at research programmes, this decreases to 18%.
- Overall, the proportion of applicants from an ethnic minority background (20%) is similar to that of the HESA population.
Chart 12. Ethnicity of our applicants across research programmes
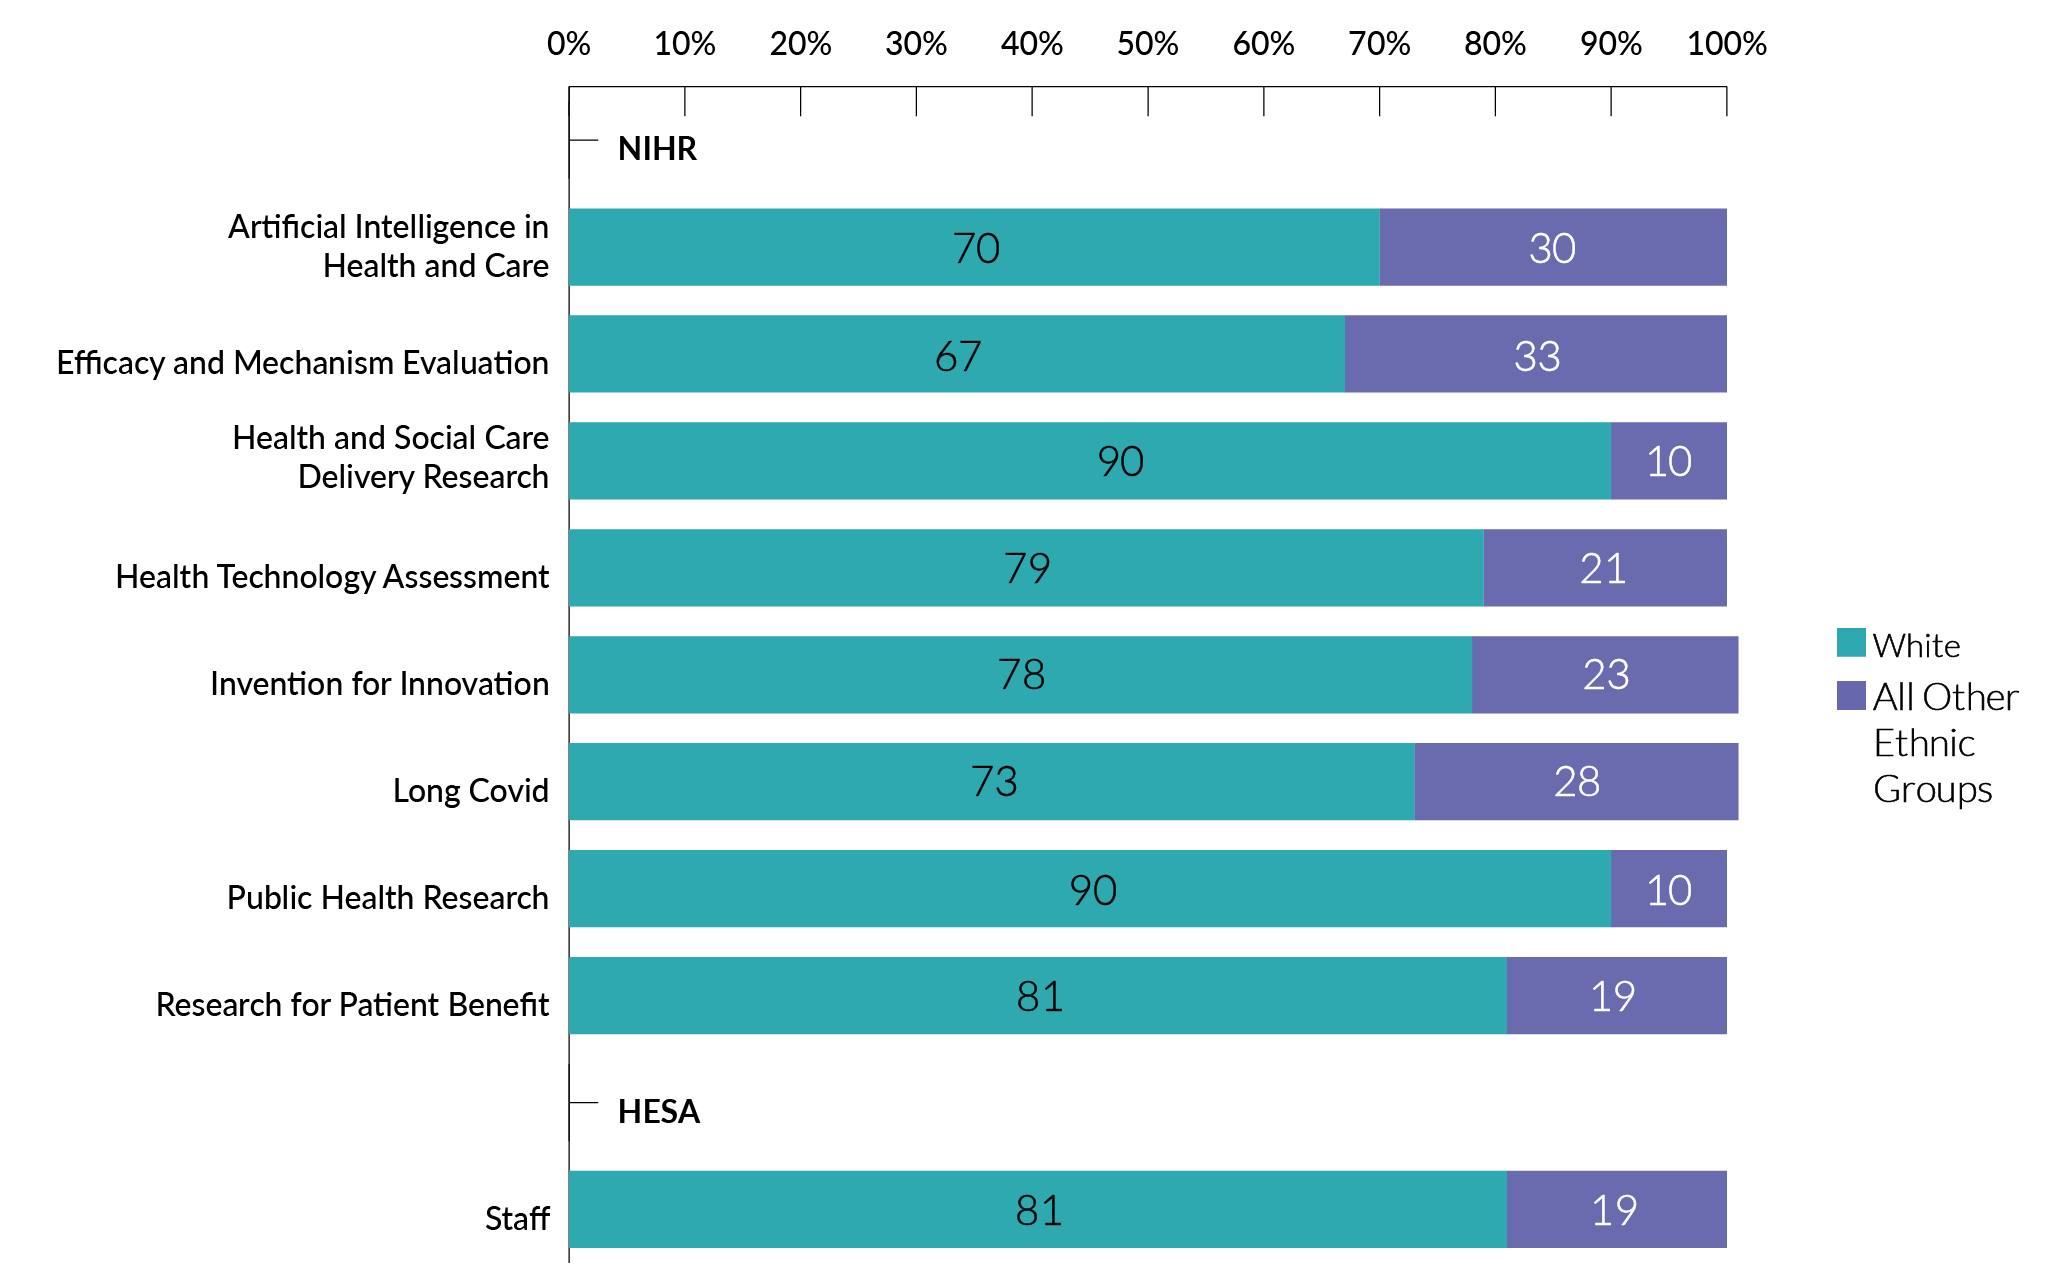
Research programmes
- There is a large variance in the proportions of Black, Asian or other ethnic minority group lead applicants across programmes, ranging from 10% to 30%. Programme-level data split by ethnic groups did not meet the minimum reporting requirements so cannot be displayed.
- Public Health Research and Health and Social Care Delivery Research programmes have the lowest percentage of applicants from an ethnic minority background.
- 6 programmes do not meet the minimum reporting requirements. The ranges quoted only reflflect those programmes where data can be reported.
Chart 13. Ethnicity of our applicants across career development programmes
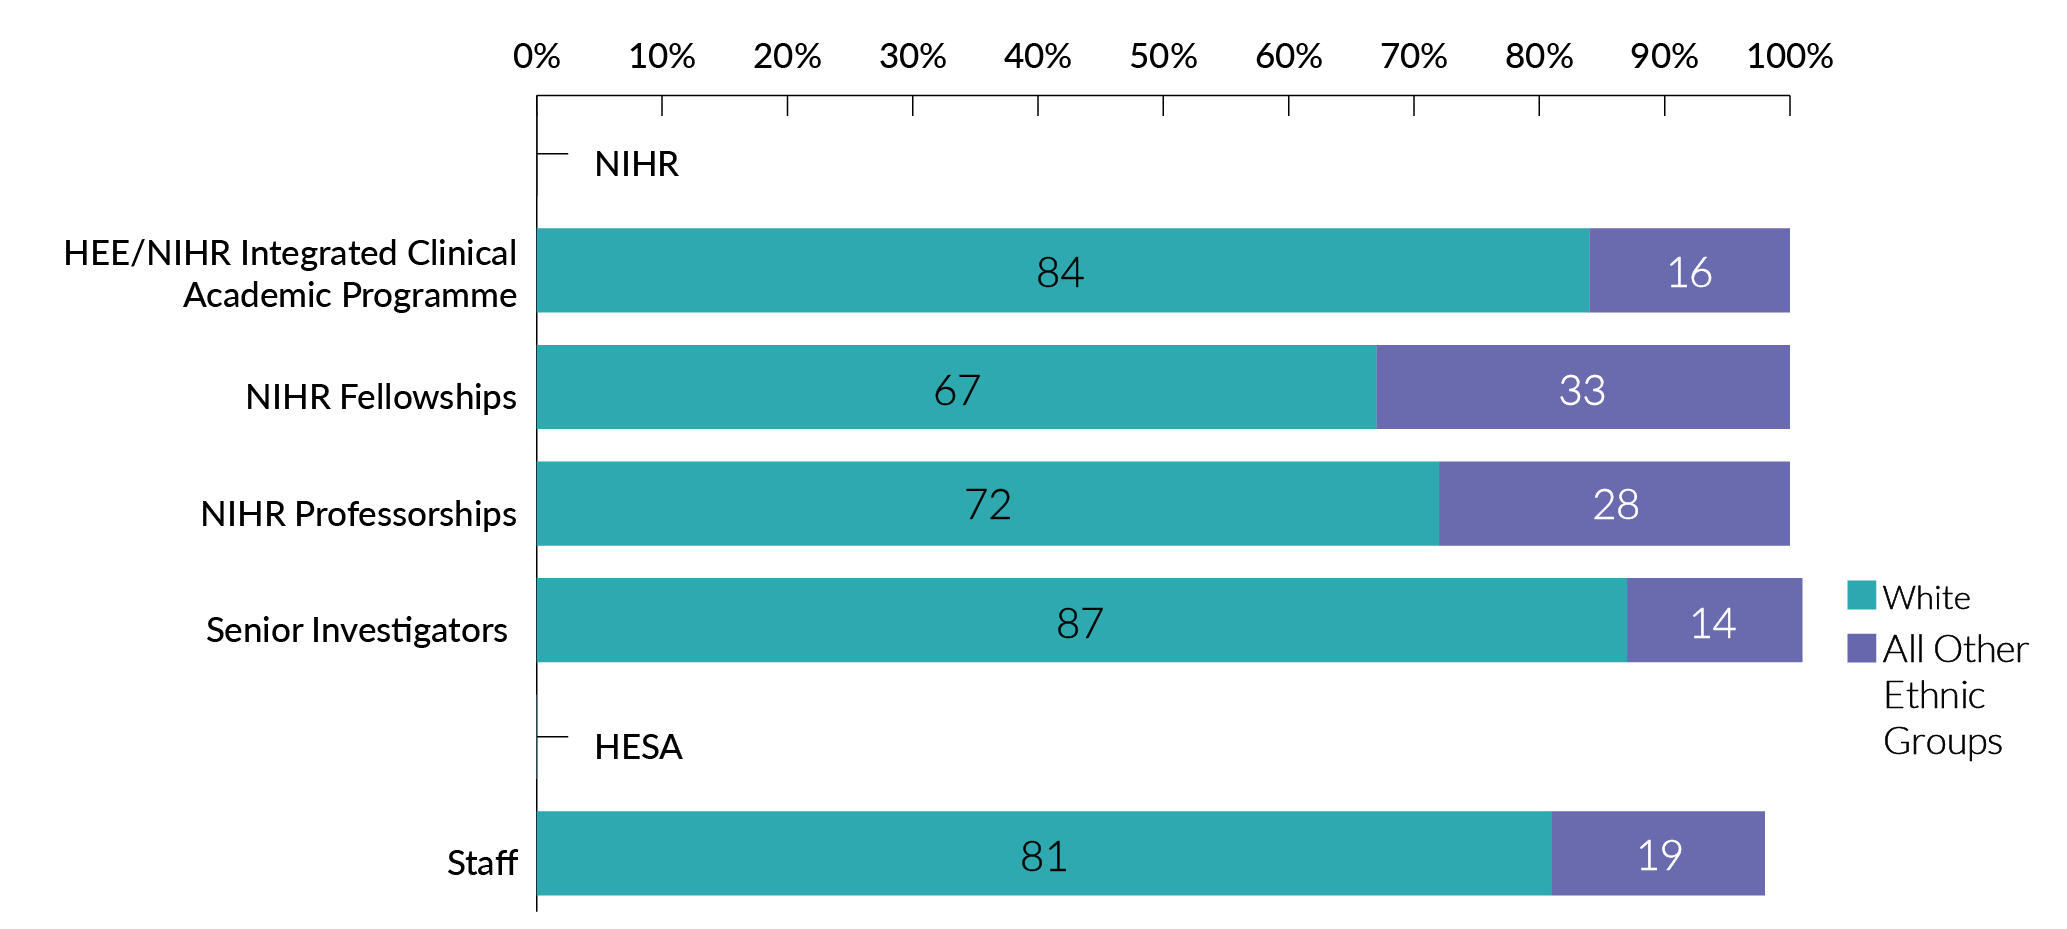
Career development programmes
- Not all programmes met minimum reporting criteria, so data cannot be shown.
- Of the programmes reported here, there are fewest applicants from ethnic minority groups to the Senior Investigator (14%) and HEE/NIHR Integrated Clinical Academic (16%) Programmes.
- The percentage of applicants from an ethnic minority background is particularly low for the Senior Investigator programme.
Chart 14. Ethnicity of our applicants across career development programme by career stage
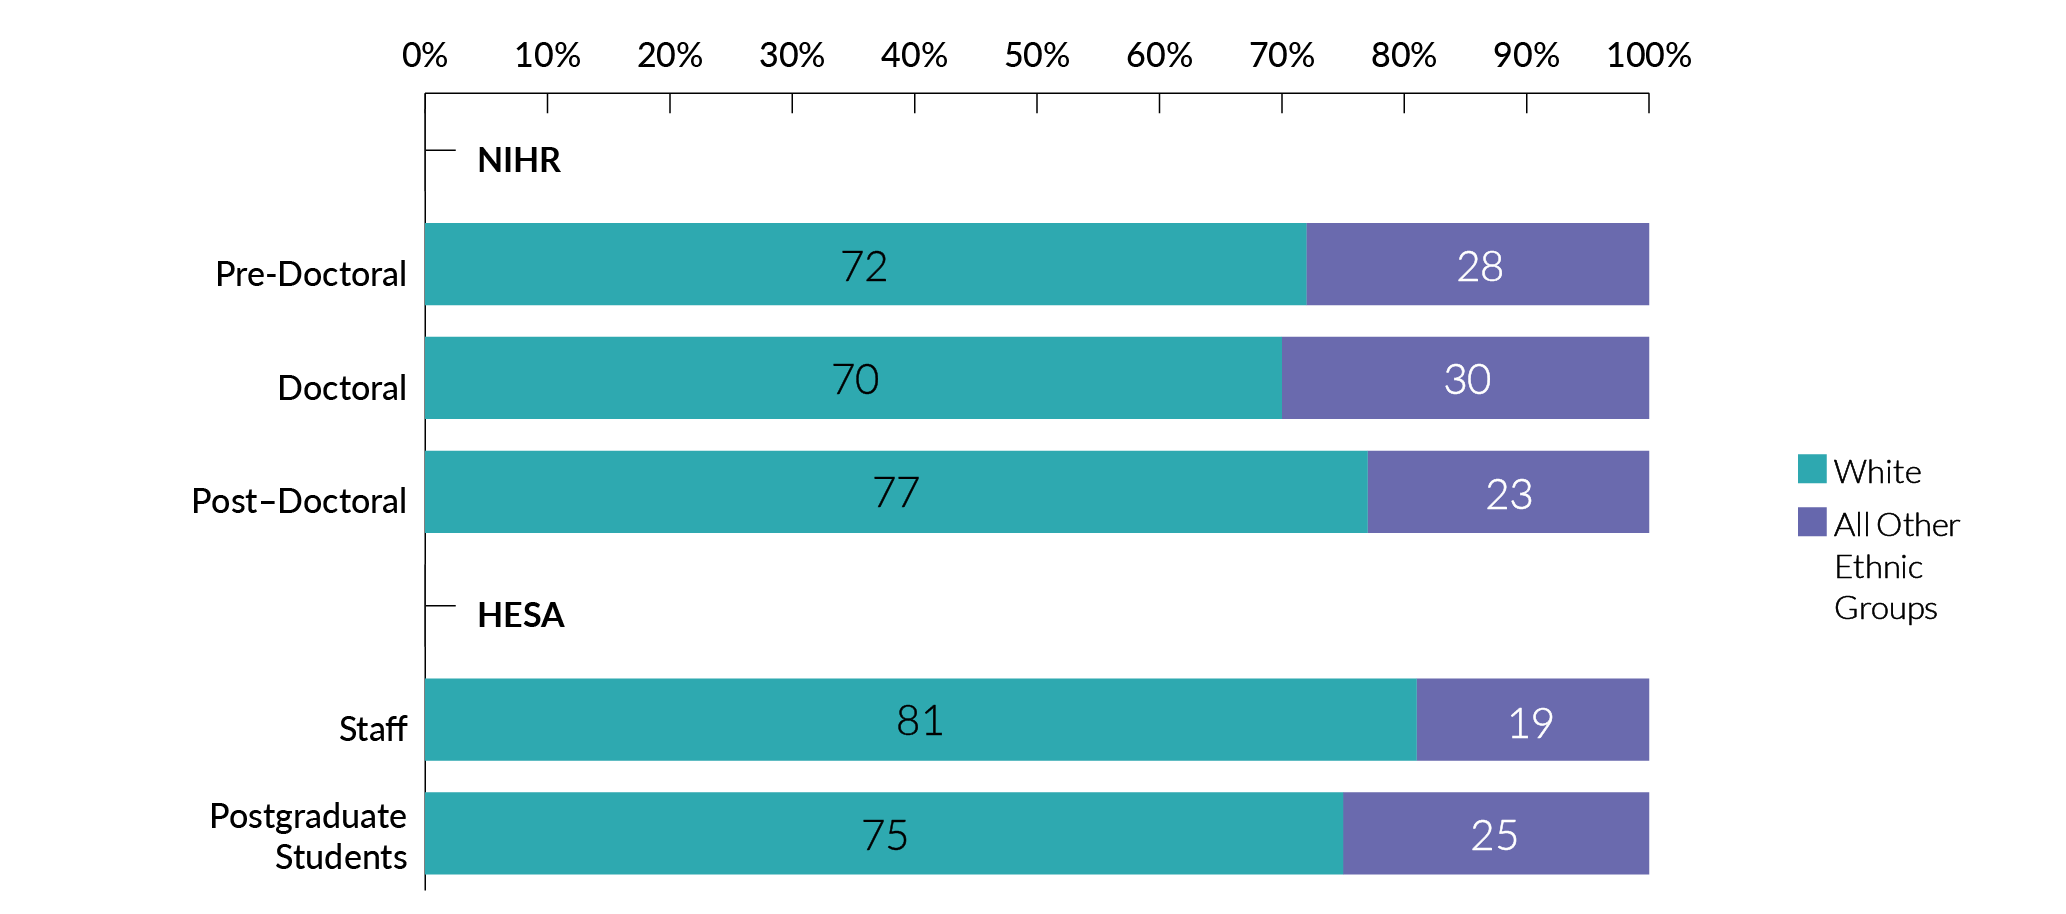
Career development programmes by career stage
- With career development programmes, 28% of pre-doctoral-stage and 30% of doctoral stage applicants come from Black, Asian or other ethnic minority groups. This is higher than reported by HESA (24.9%).
- From pre- to post-doctoral career stage, there is a 5% reduction in Black applicants.
- At the post-doctoral level, the percentage of applicants from ethnic minority groups is lower than pre-doctoral and doctoral, at 22.9%.
- When grouped together, the percentage of applicants from ethnic minority groups at doctoral level and above is 24.6%.
Chart 15. Amount applied for by ethnicity
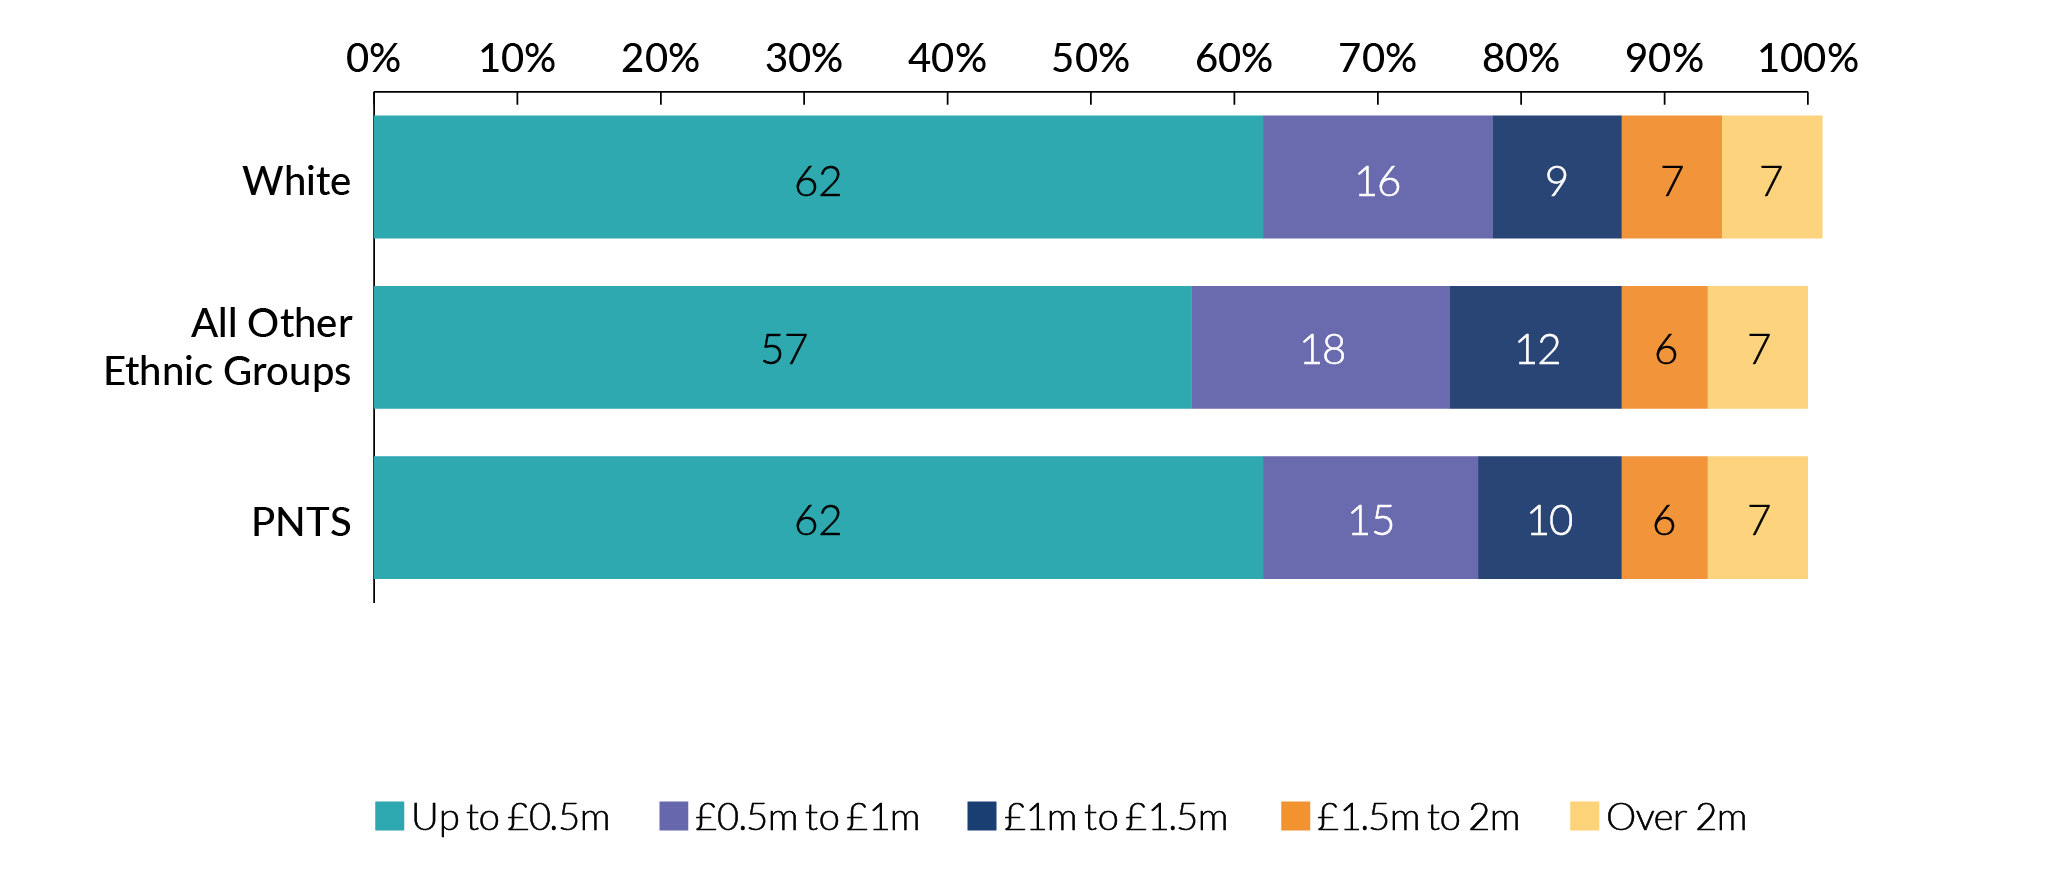
Application value
- On average, people from ethnic minority groups apply for £60,000 more than people from White backgrounds.
1.4 Sex
Chart 16. Sex of our applicants by programme type
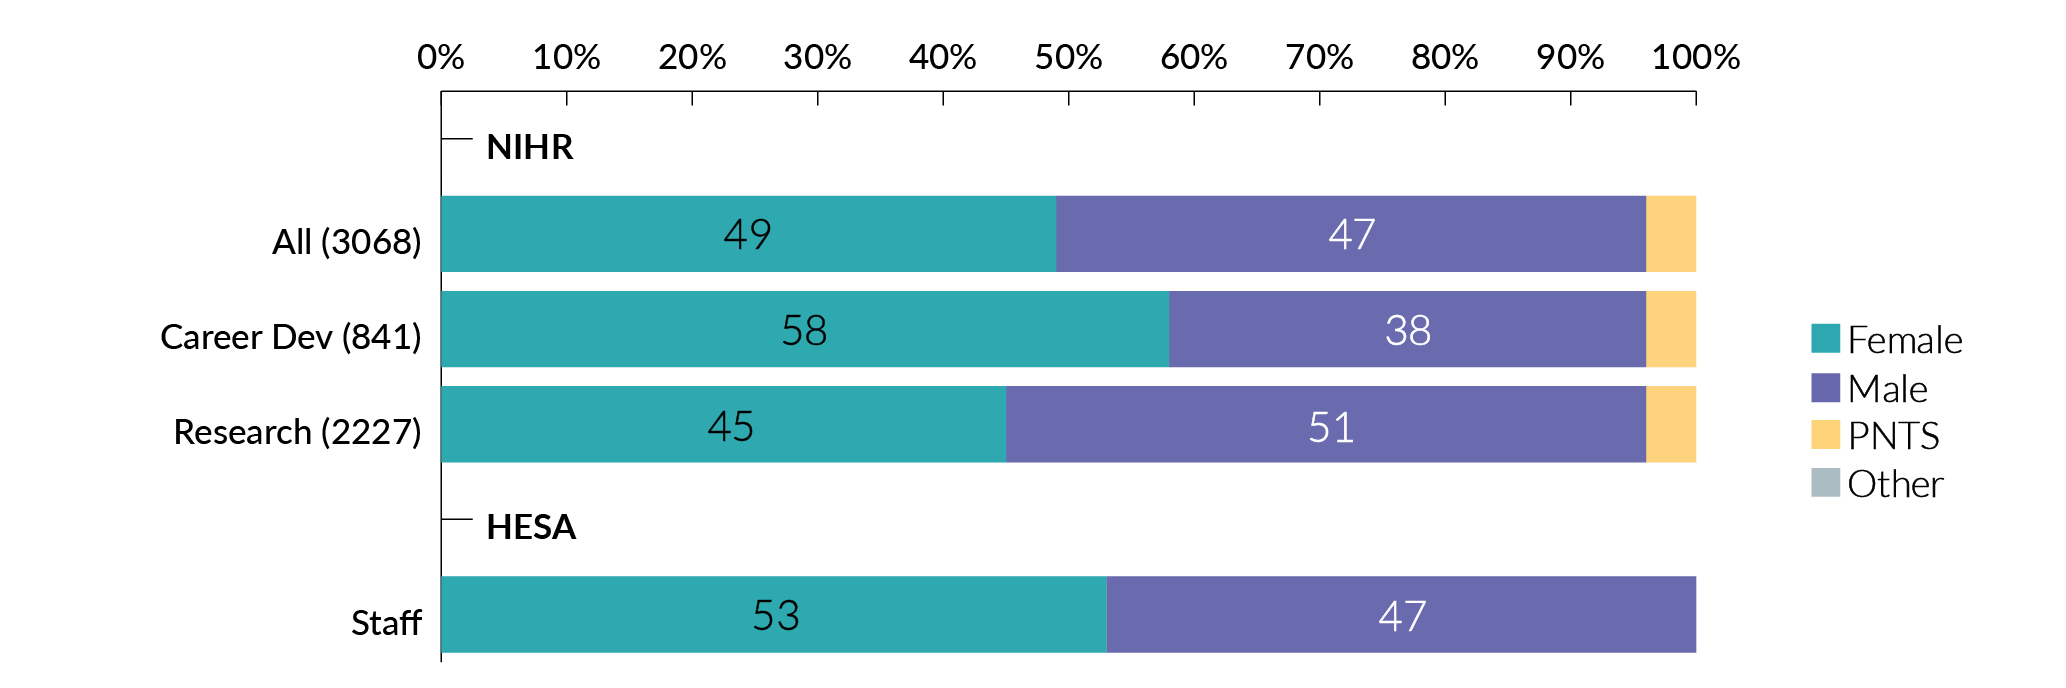
Programme type
- 49% of all applicants are female, which is lower than HESA (53%).
- There was a higher proportion of female applicants to career development programmes (58%) than to research programmes (45%).
Chart 17. Sex of our applicants across research programmes
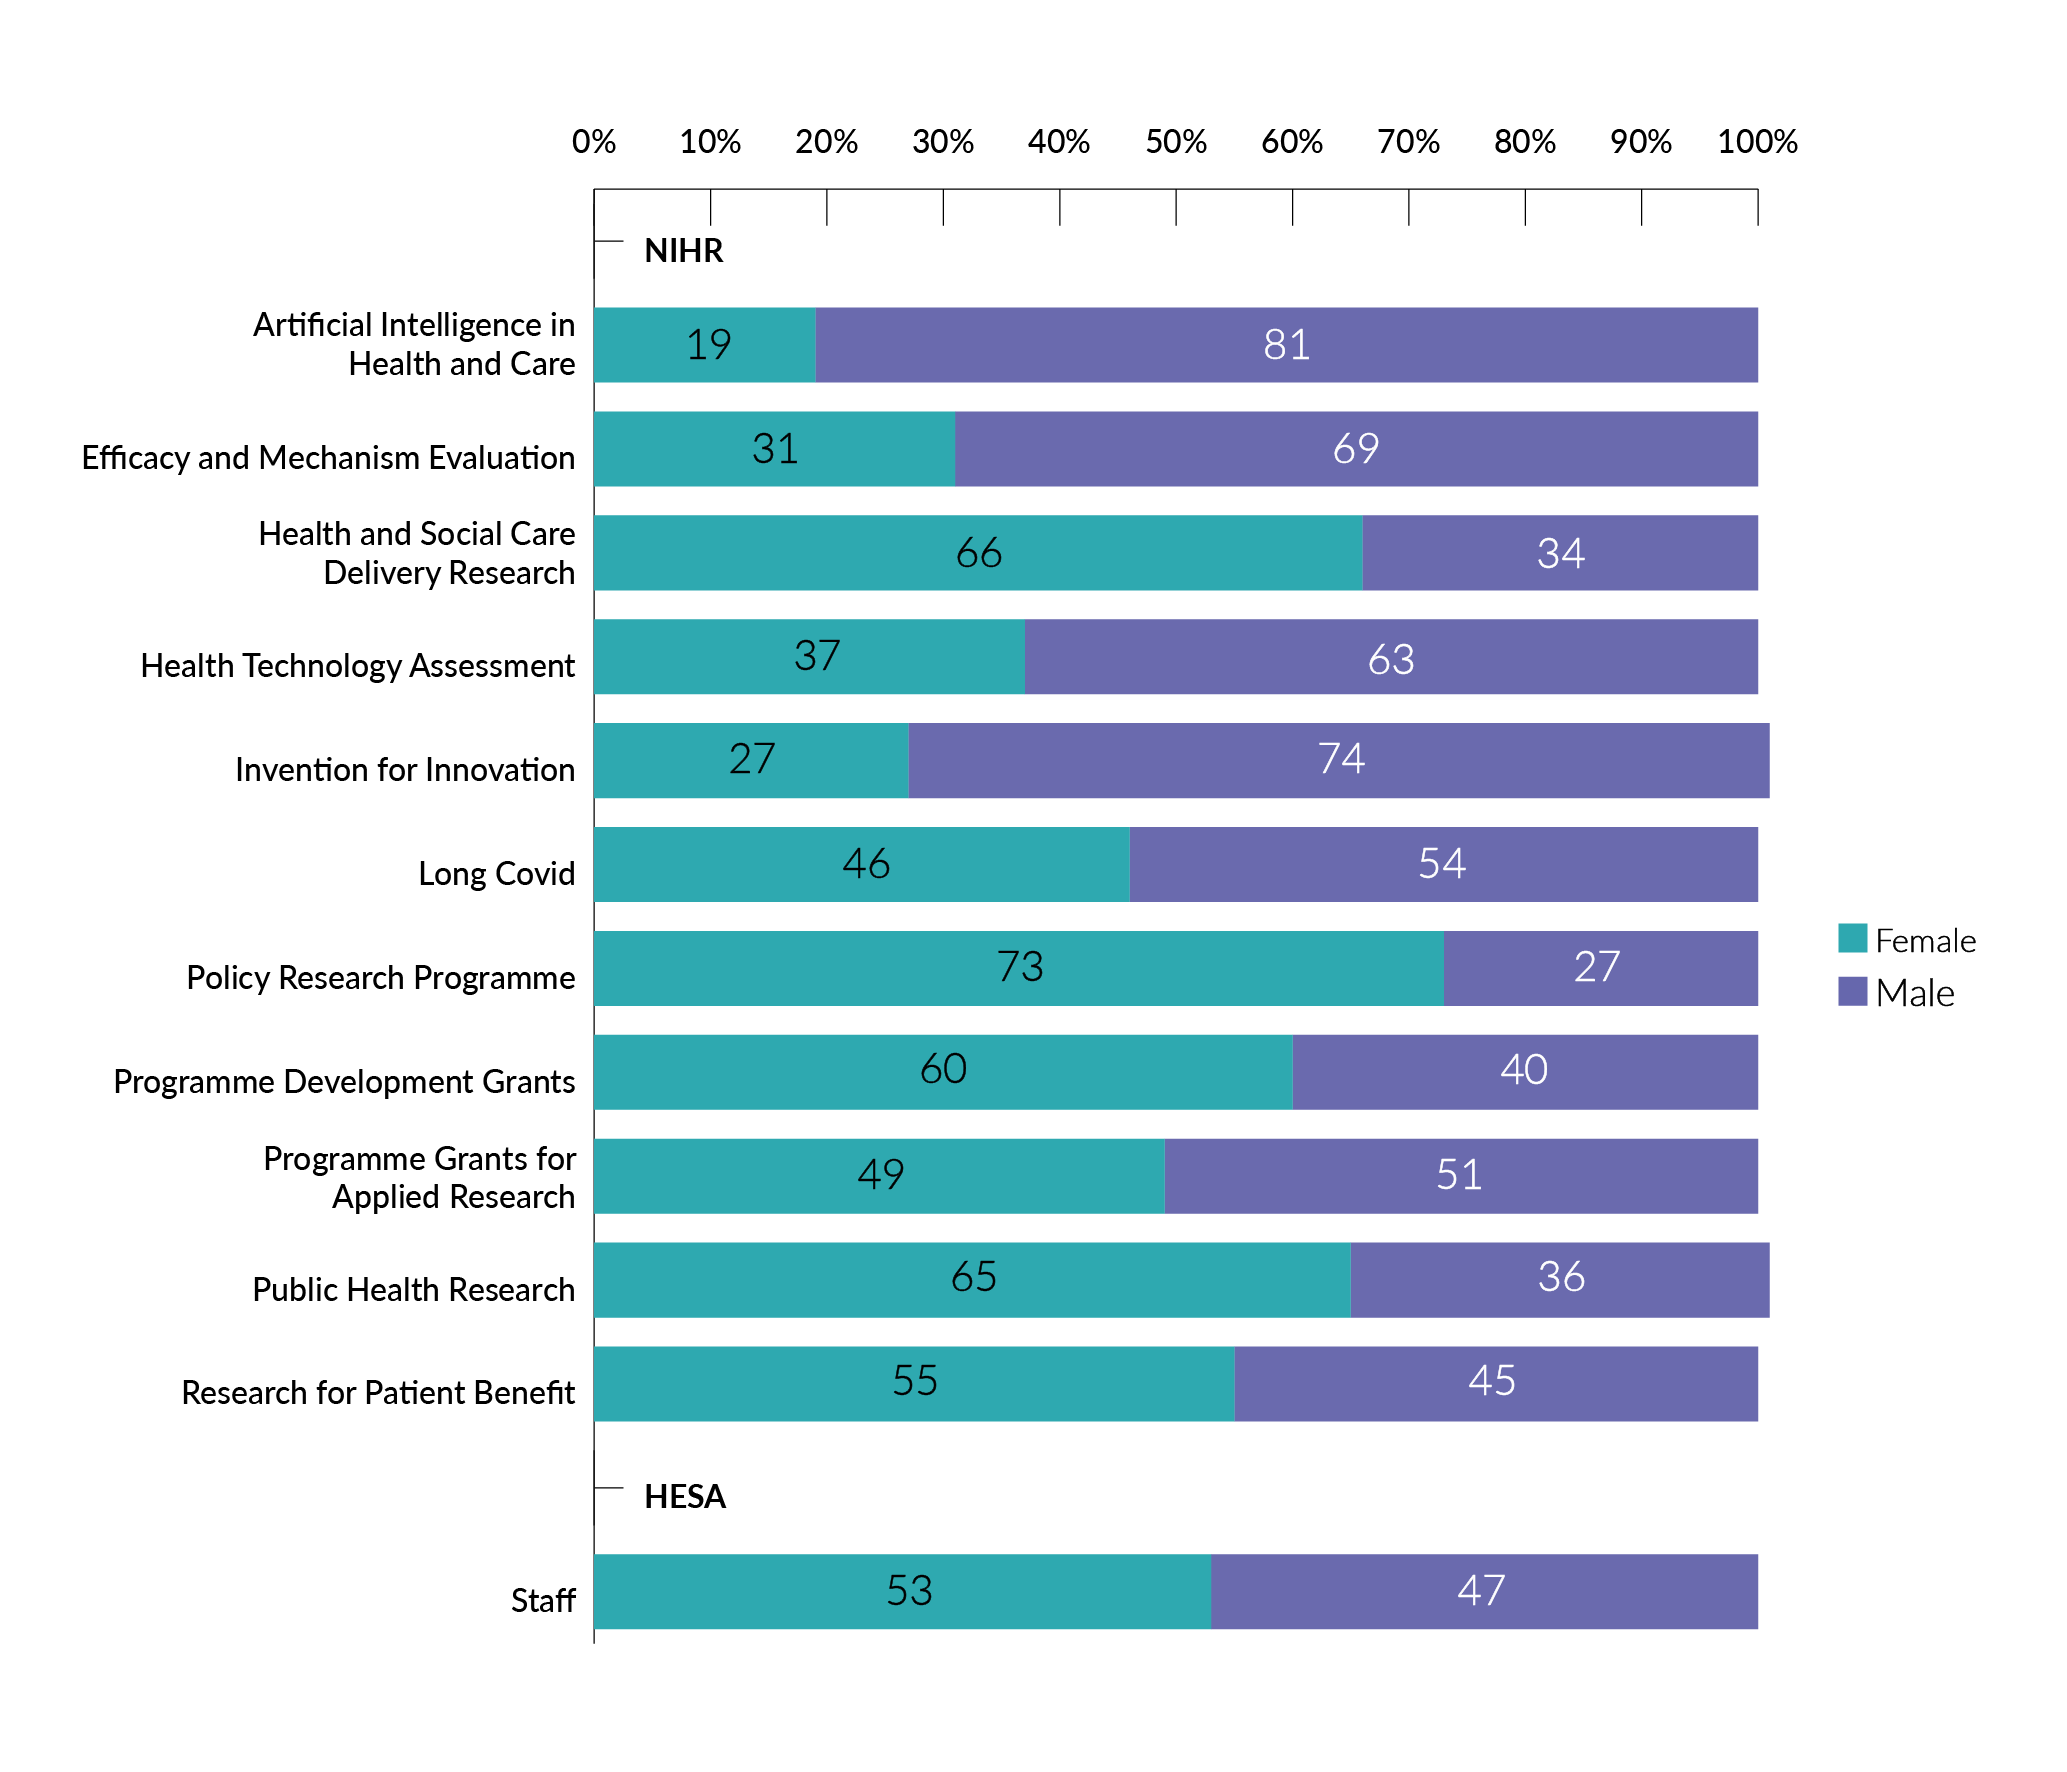
Research programmes
- There is a large variation in the proportion of female applicants by programme from 19% to 73%.
- Some programmes have very low numbers of female applicants in comparison to the HESA data. This may be a reflection of the lack of diversity within the discipline or sector – for example, low female representation in AI.
- The ranges quoted only reflect those programmes where data can be reported.
Chart 18. Sex of our applicants across career development programmes
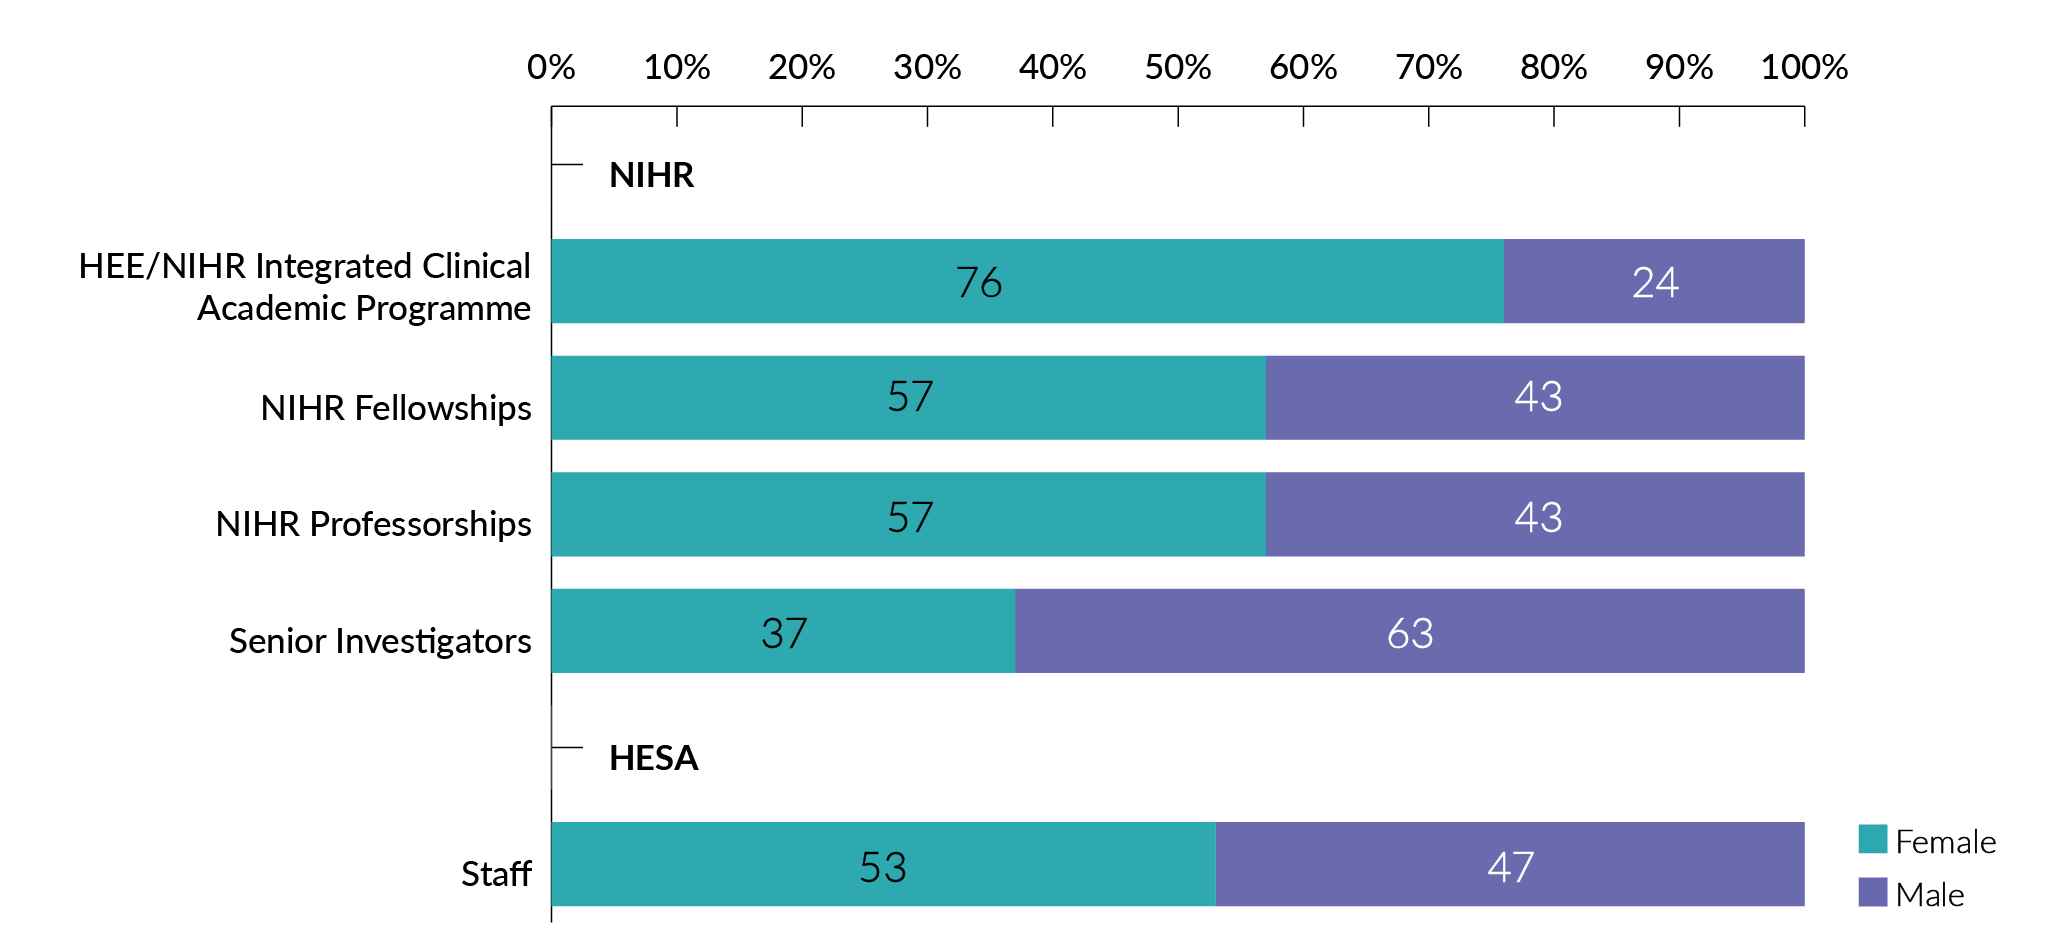
Career development programmes
- The proportion of female applicants ranges from 37% to 76% across our career development programmes compared to 53% females in HESA data.
- Male applications for HEE/NIHR Integrated Clinical Academic Programme are comparatively low.
- The lowest proportion of female applications was for Senior Investigator awards (37%), which may reflect the smaller pool of senior female researchers. Only 4% of the total female academic staff reported by HESA were professorial or another senior academic grade.
- Some programmes did not reach the reporting threshold and data could not be included.
Chart 19. Sex of our applicants across career development programmes by career stage
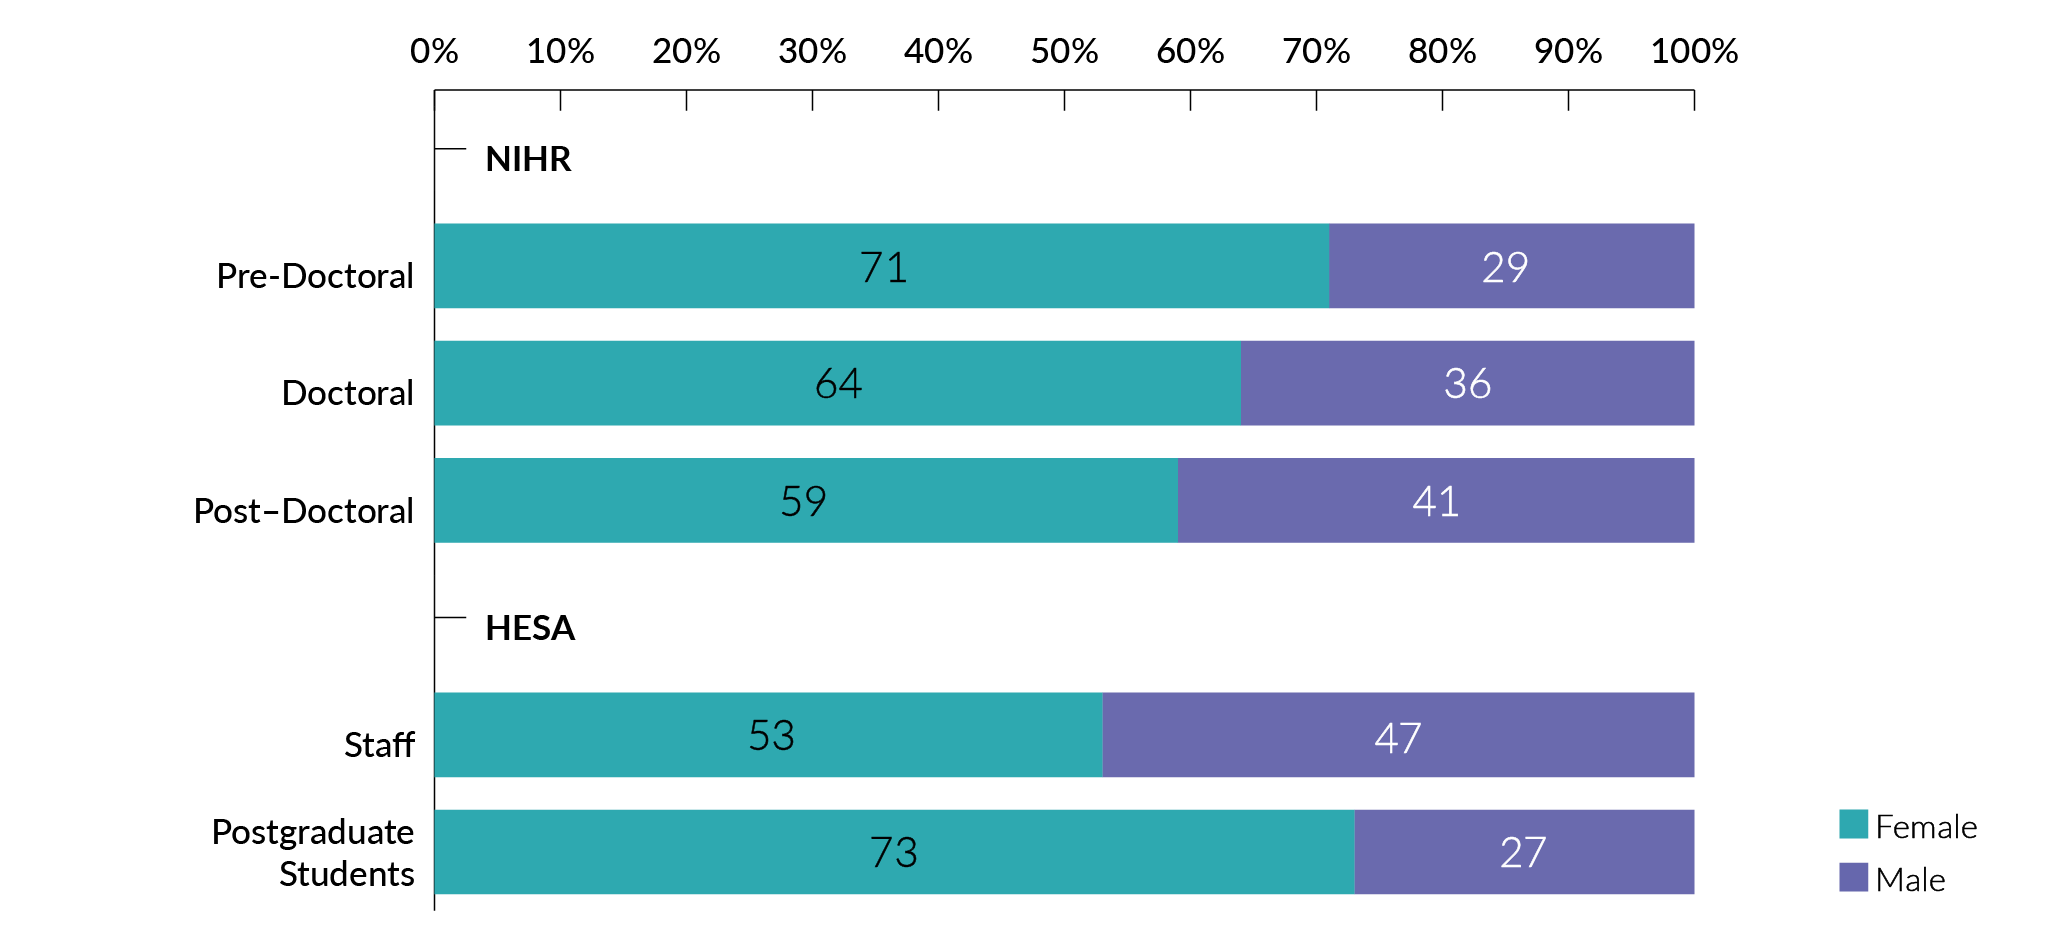
Career development programmes
- Further breakdown of career development applications by career stage shows that female application rates decline with increasing career stage.
- Females are most likely to apply at the pre-doctoral level. This trend may be driven by the high number of female applicants for the HEE/NIHR Integrated Clinical Academic Programme, which does not require applicants to have a doctoral degree.
- Female applications at the post-doctoral level (59%) are lower than the HESA postgraduate data for females (73%).
Chart 20. Amount applied for by sex
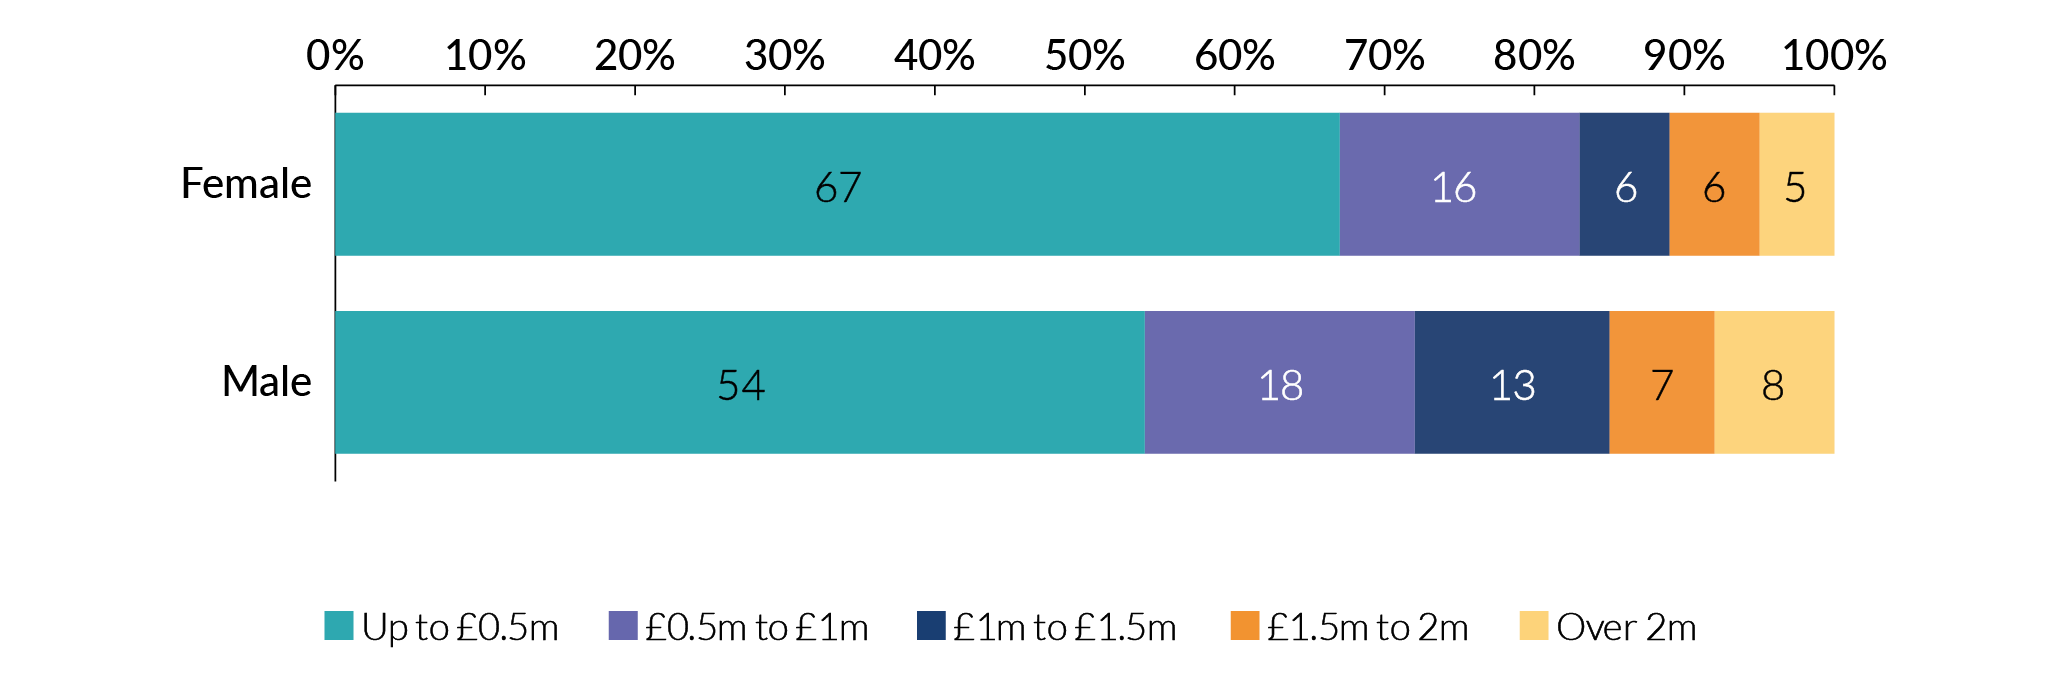
Application value
- Males on average apply for £120,000 more than females. This is likely driven by the higher application rates of females for early career development funding, where both the funding amount and award duration are typically lower than at the professor or senior investigator level.
Application outcomes
2.1 Age
Chart 21. Success rates by age group for all programmes combined
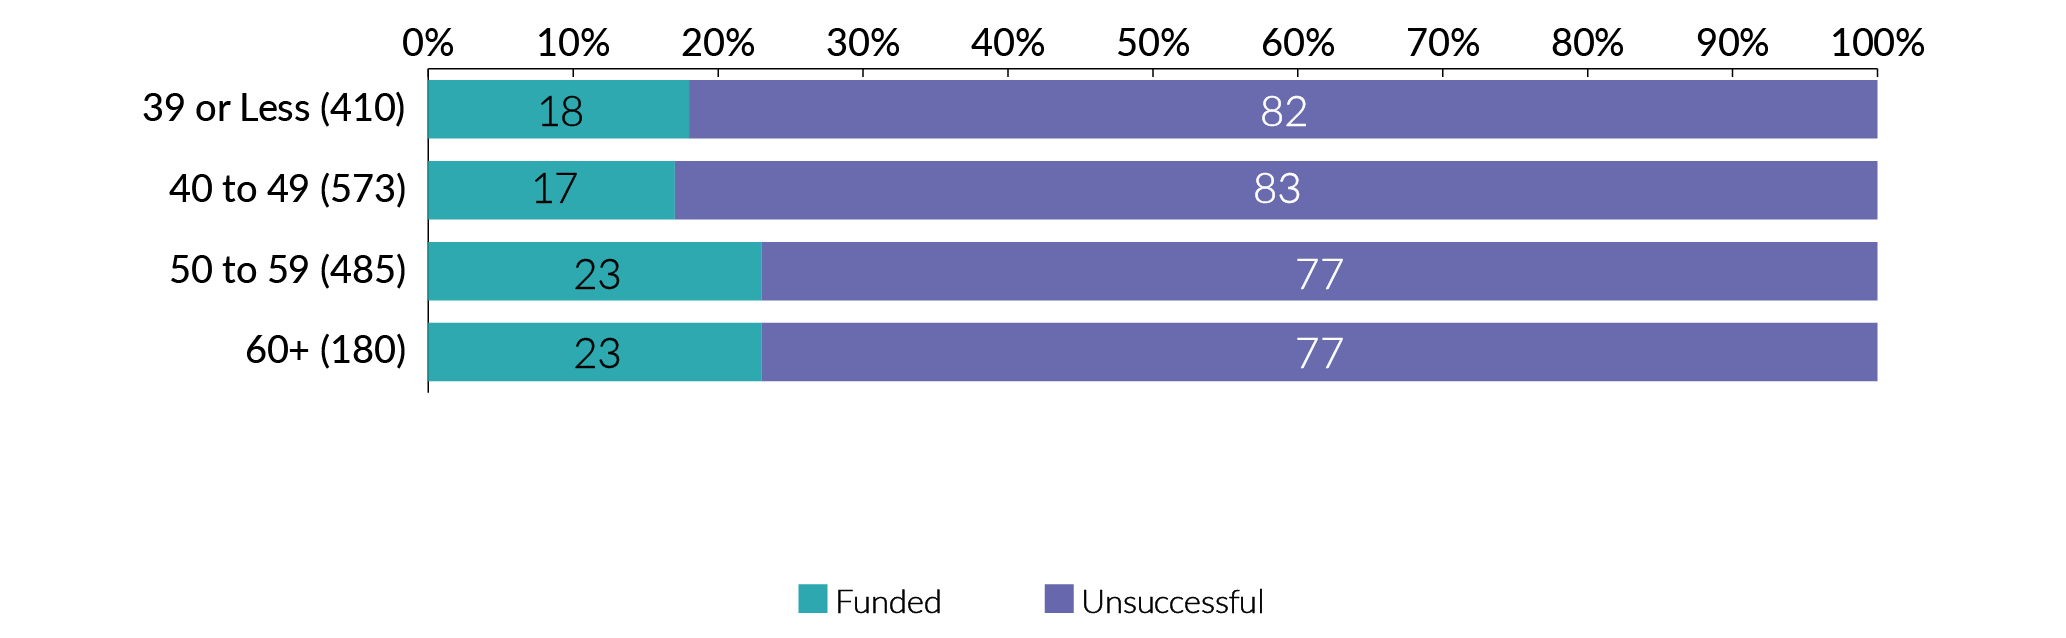
Chart 22. Success rates by age group for career development programmes
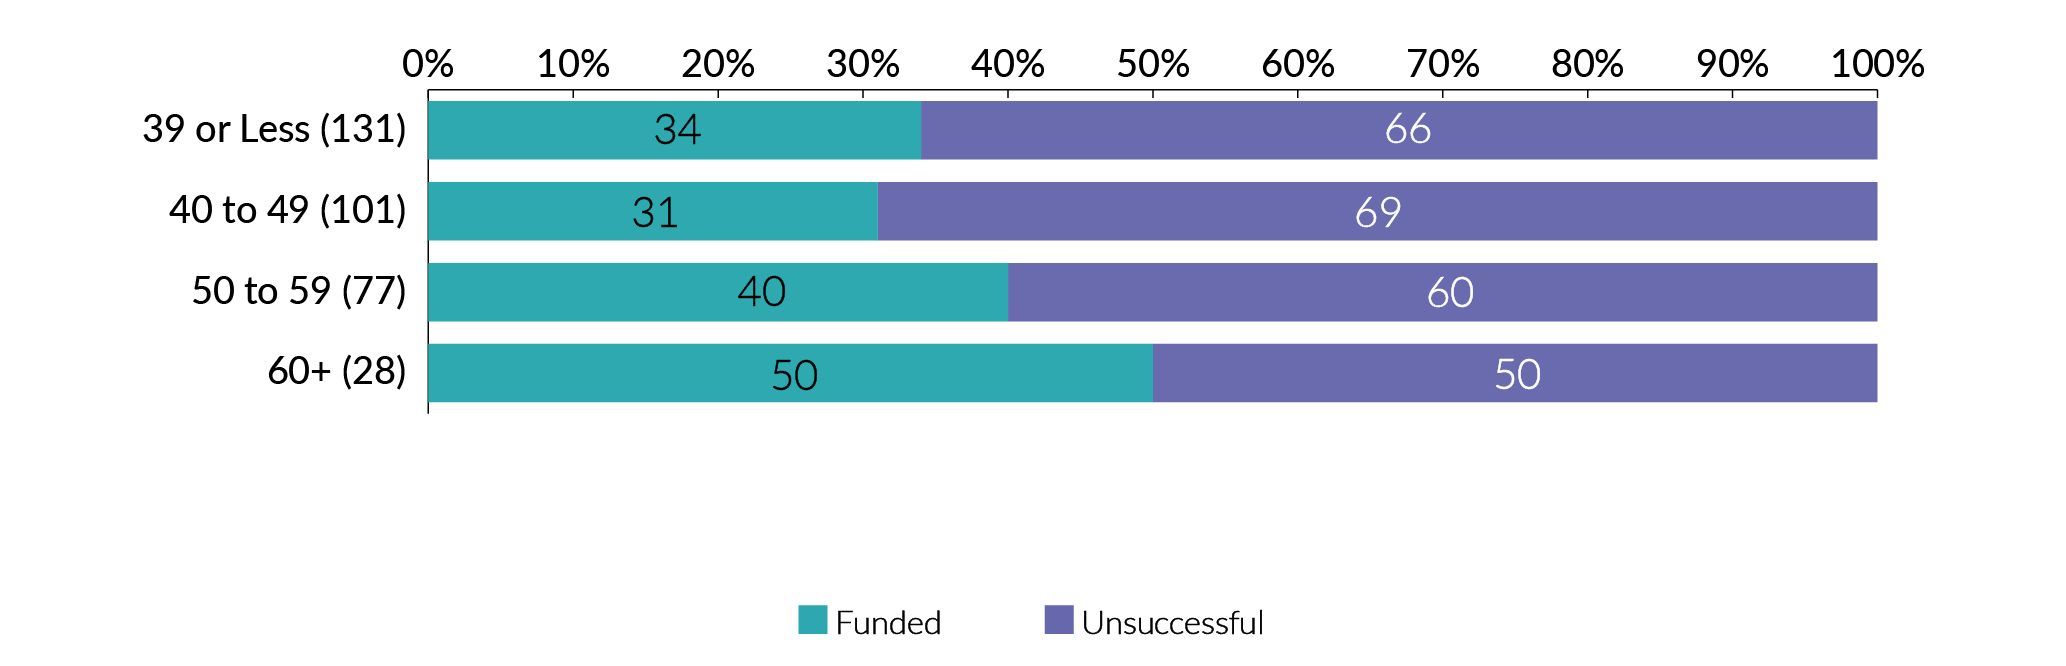
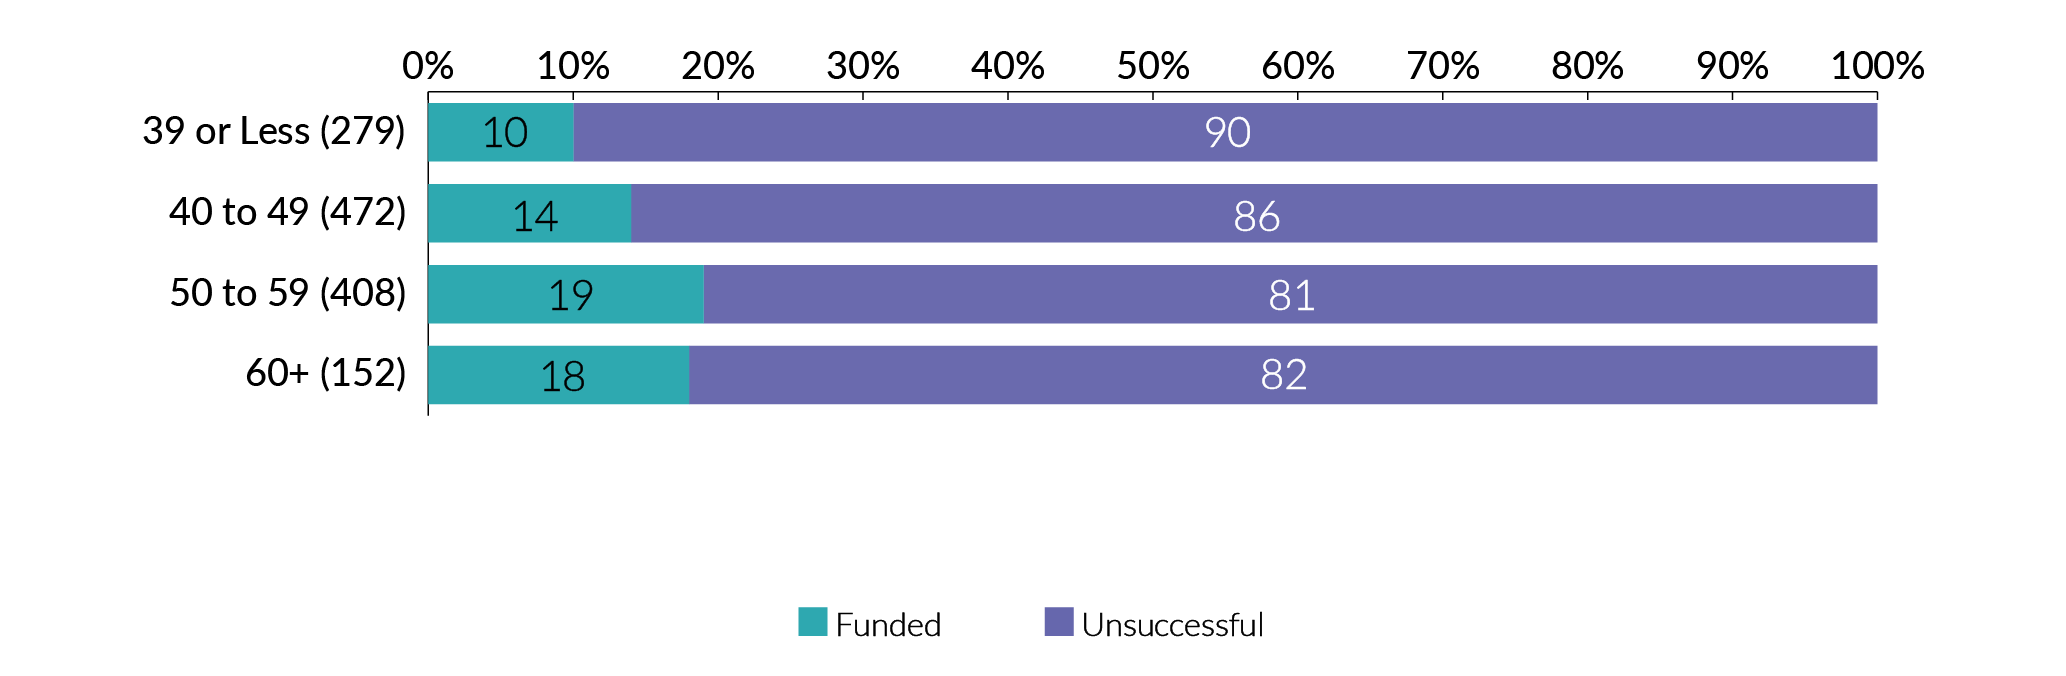
Chart 23 Success rates by age group for research programmes
- The likelihood of funding success increases with age from 18% in applicants who are younger than 39 to 23% in applicants aged over 60.
- Career development applicants aged over 60 are 16% more likely to be funded than applicants who are younger than 39. This difference is likely a reflection of the much larger numbers of applicants from the younger age group compared to the small numbers of applicants who are over 60.
- Research programme applicants aged 50-59 are most likely to receive funding (19%). Those aged less than 39 are the least likely to be successful (10%).
2.2 Disability
Chart 24. Success rates by disability status for all programmes combined
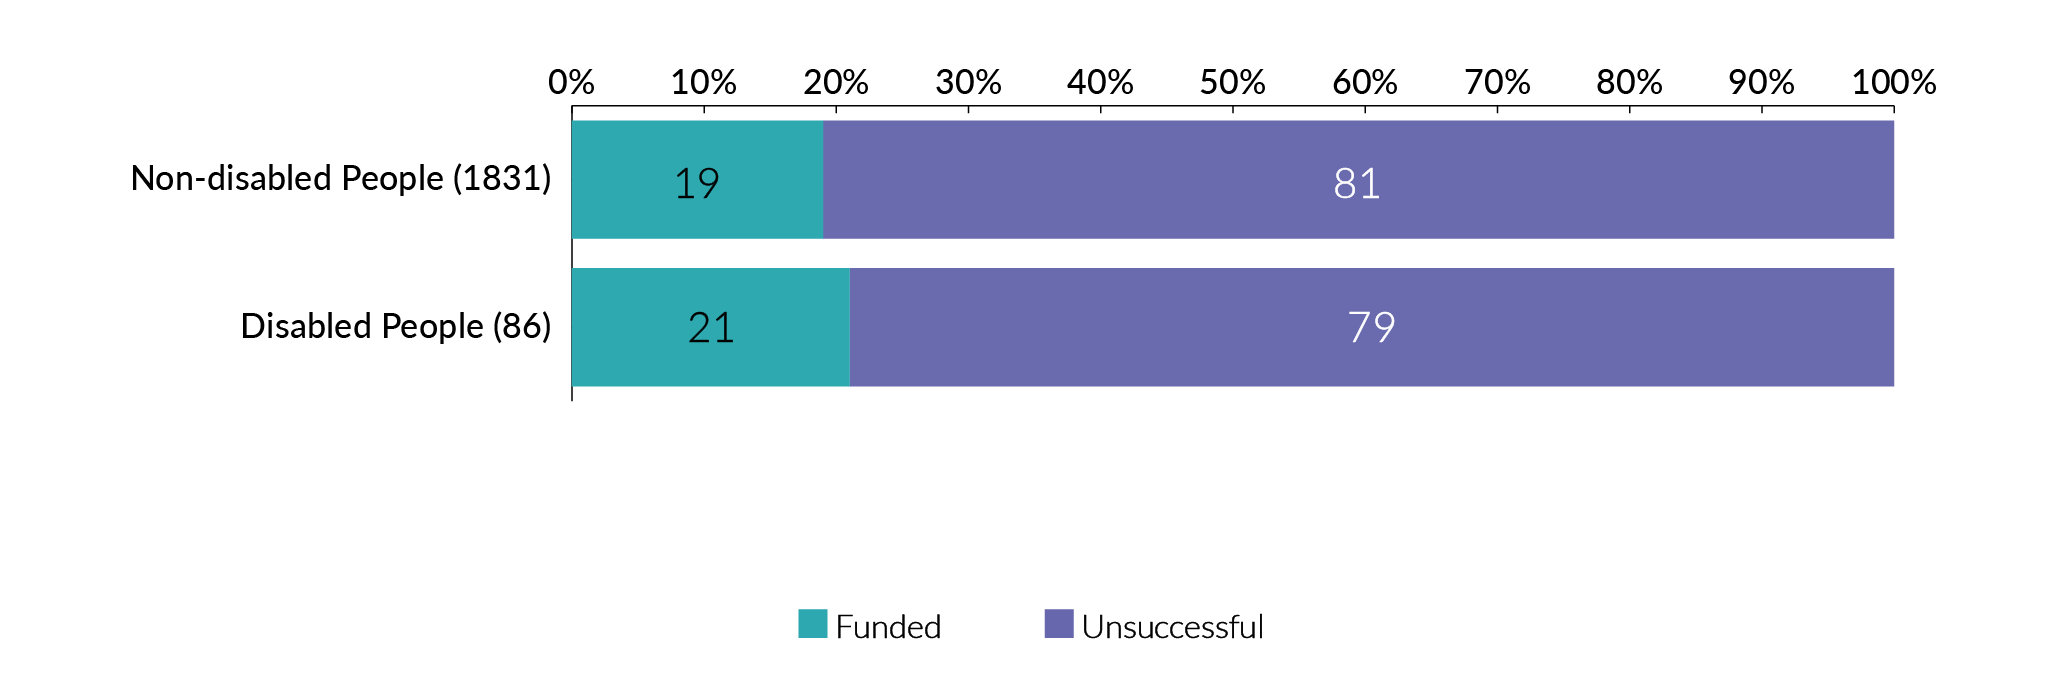
- 21% of applicants who declare a disability are successful compared to 19% of applicants who do not declare a disability.
2.3 Ethnicity
Chart 25. Success rates by ethnicity for all programmes combined
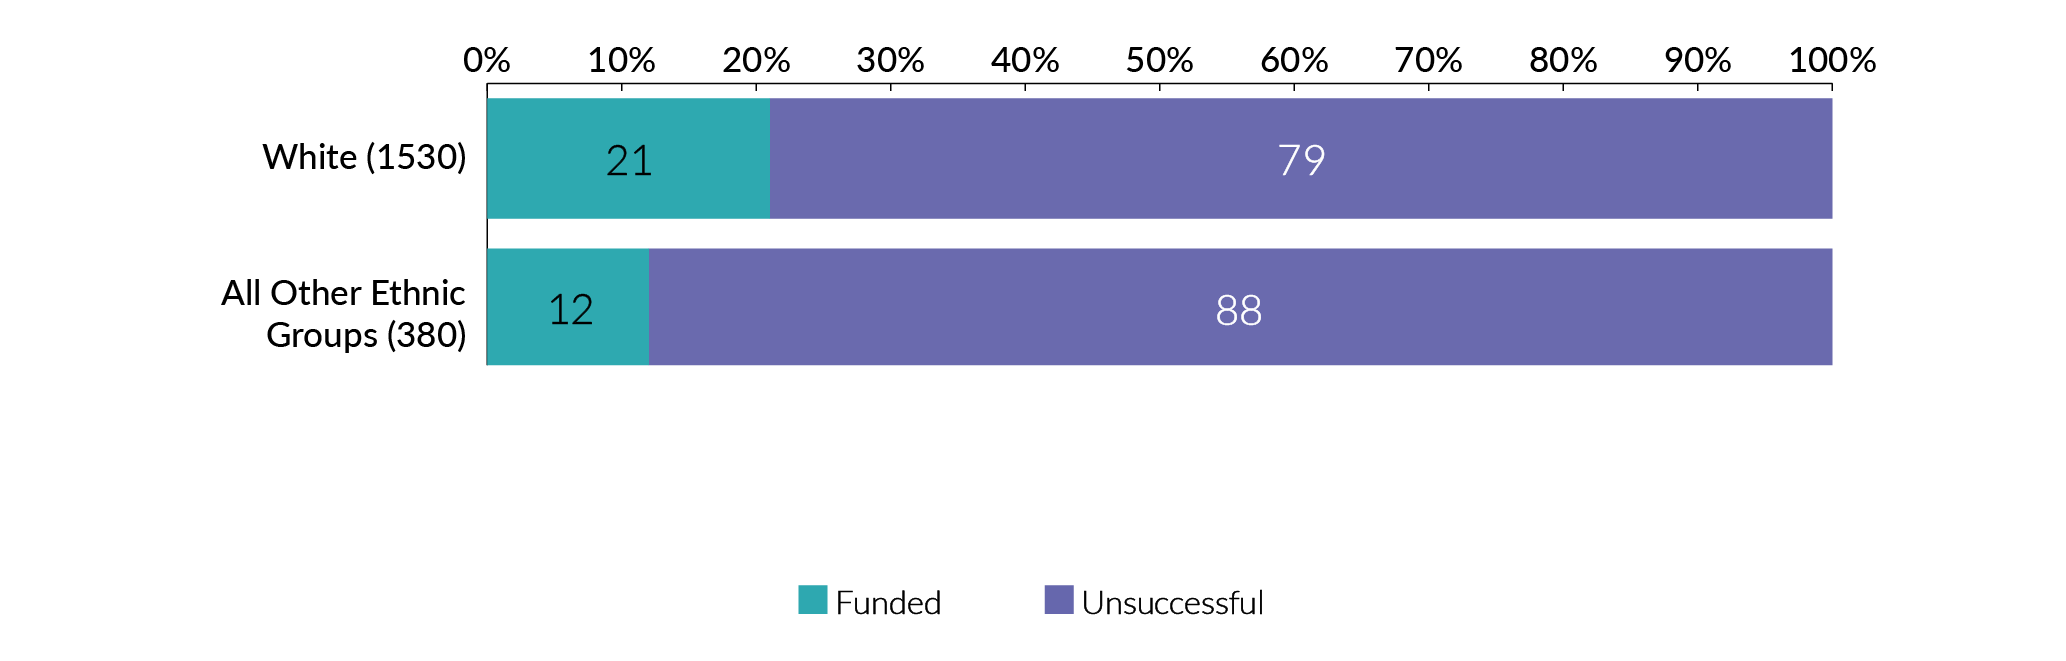
Chart 26. Success rates by ethnicity for career development programmes
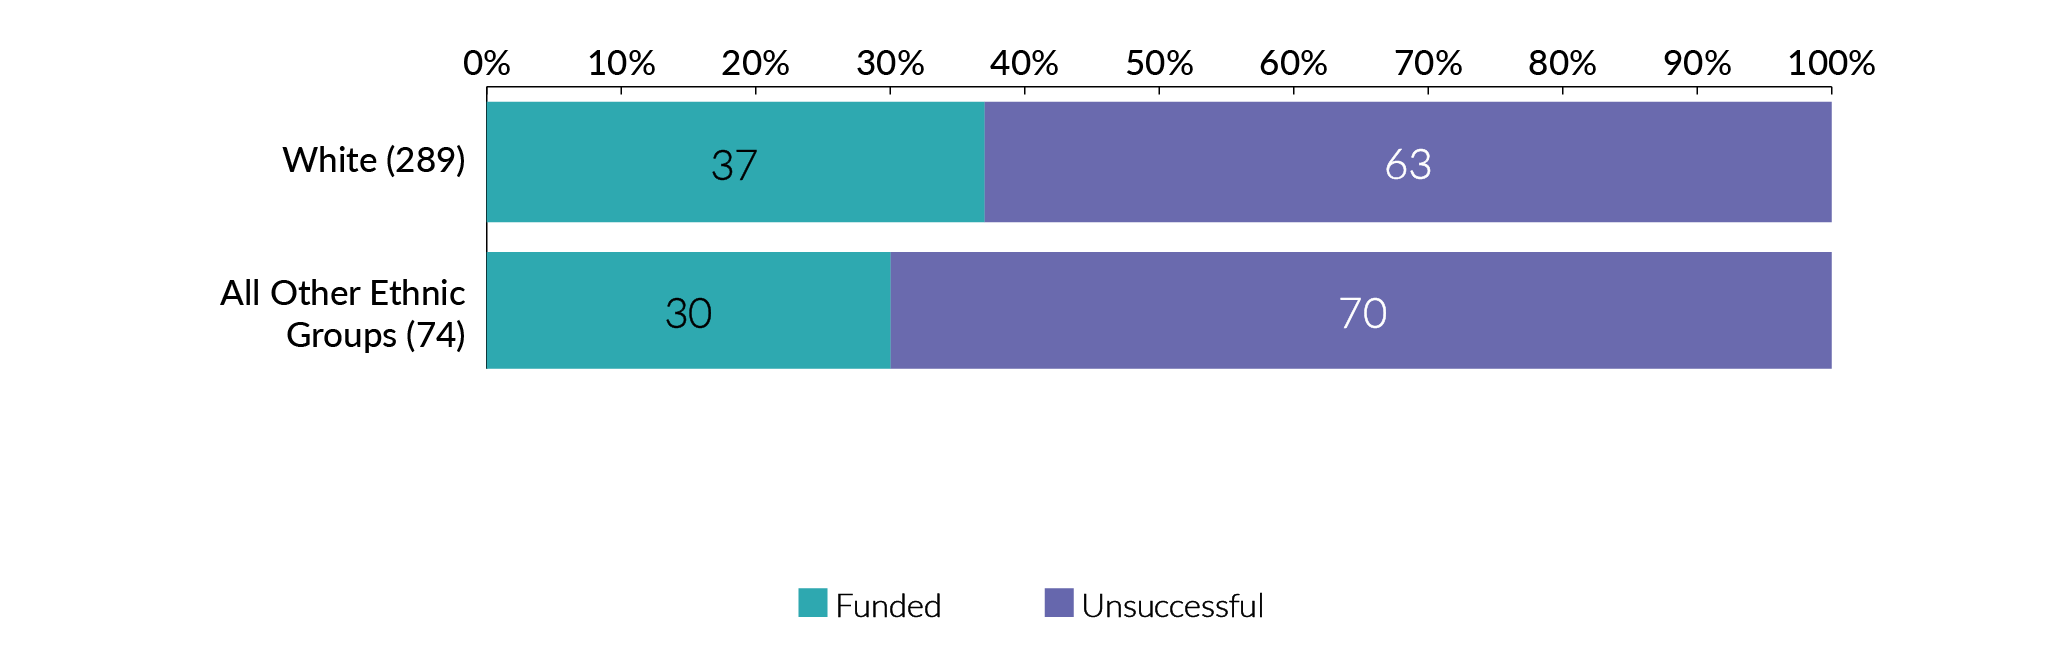
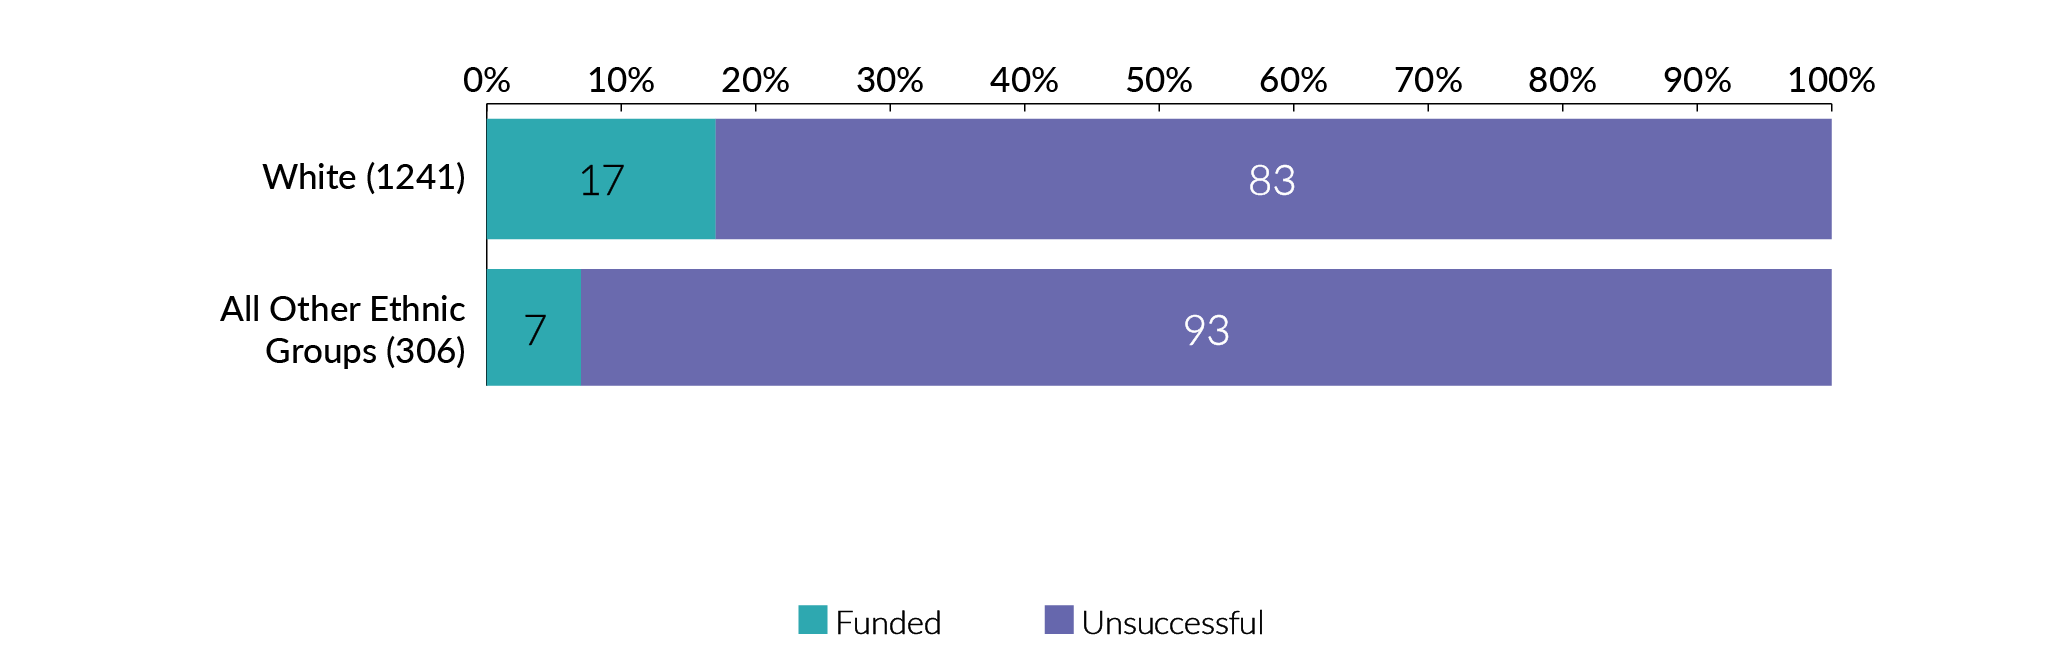
Chart 27. Success rates by ethnicity for research programmes
- 12% of applicants from an ethnic minority background are successful in their funding applications compared to 21% of White applicants.
- Applicants from ethnic minority backgrounds are less likely to receive funding for both career development (7% less likely) and research (10% less likely) programmes. This shows that the gap has widened from last year.
- Chi-Square tests of Independence were performed to assess the relationship between ethnicity and application outcomes for career development and research programmes. The analysis showed that applicants from ethnic minority groups are significantly (p<0.001) less likely to be successful when applying for research programmes than white applicants.
- We will continue to target researchers from ethnic minority backgrounds to apply to the NIHR. We are reviewing all of our processes to ensure that they are inclusive.
2.4 Sex
Chart 28. Success rates by sex for all programmes combined
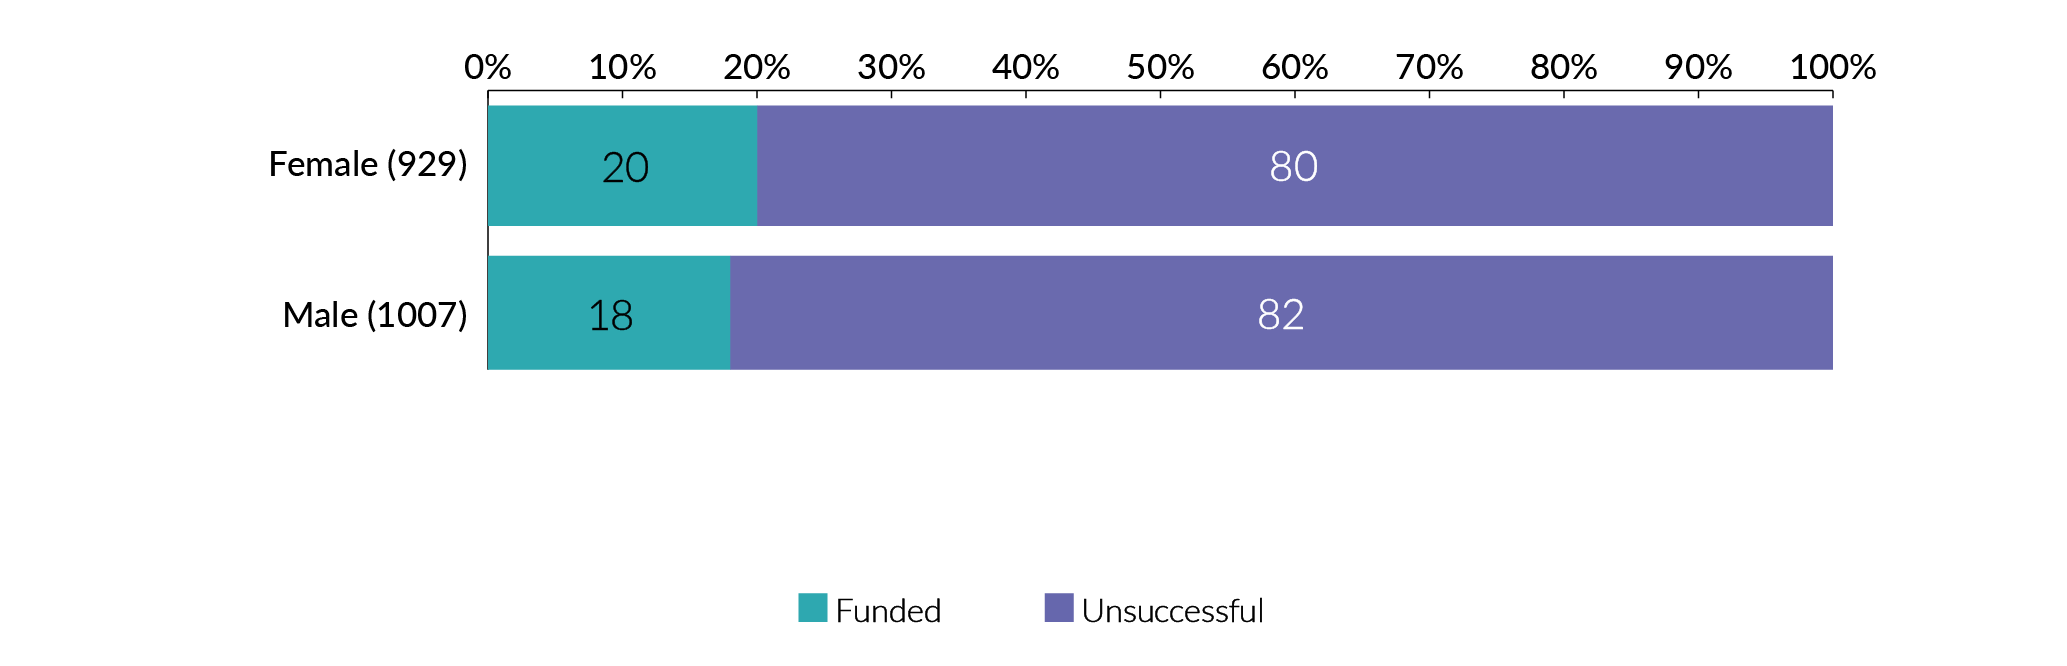
Chart 29. Success rates by sex for career development programmes
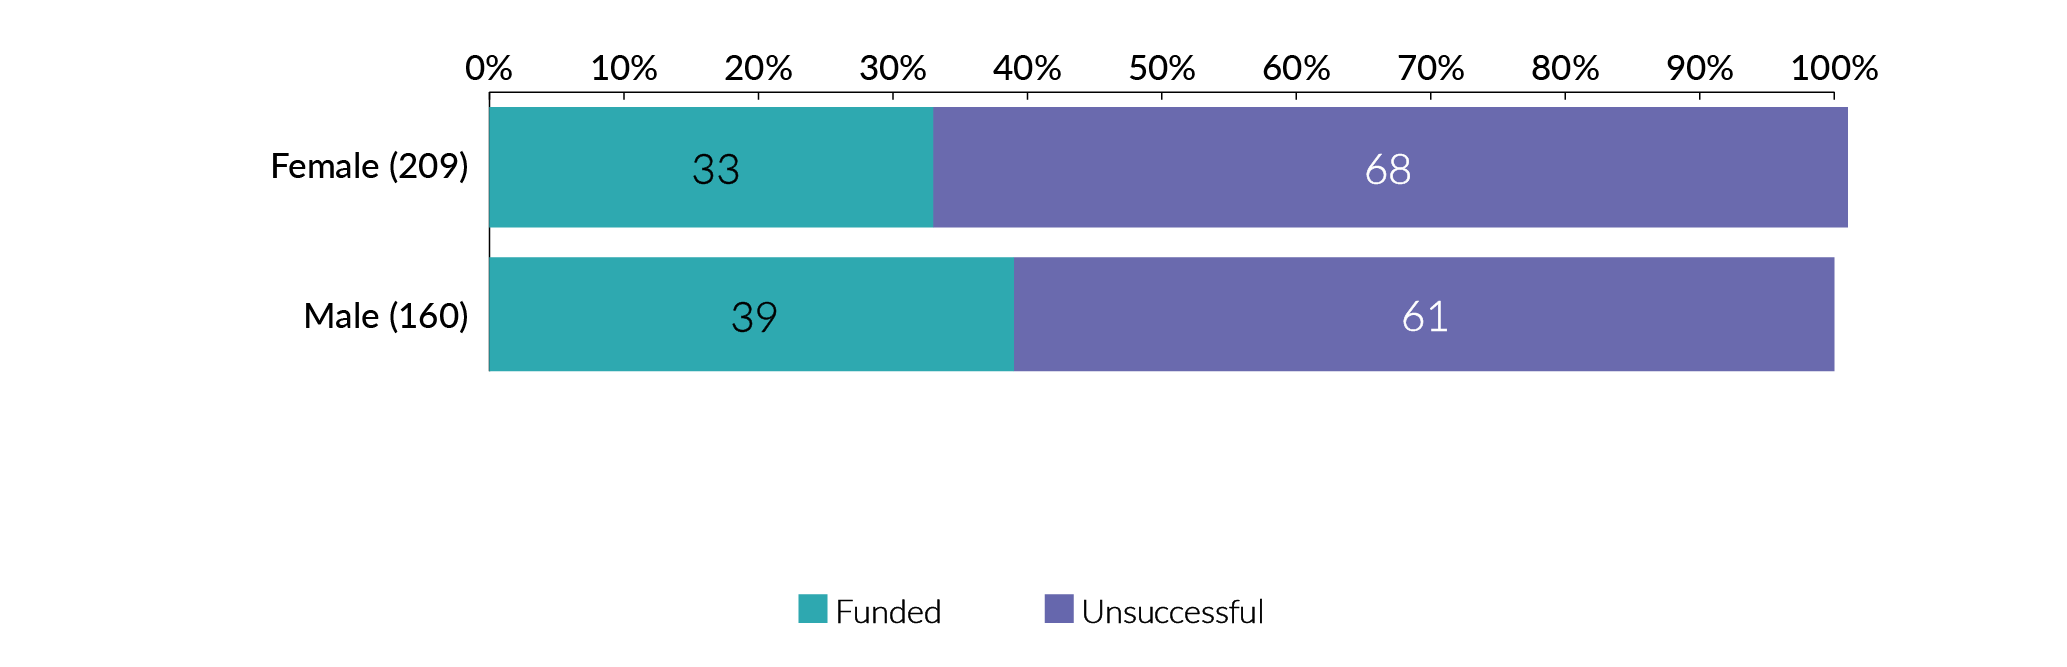
Chart 30. Success rates by sex for research programmes

- Overall females are 2% more likely to be successful in their funding applications compared to males. This trend is the same for research programmes.
- For career development funding, males are 6% more likely to be funded than females.
Award holders
3.1 Age
Chart 31. Age of our award holders by programme type
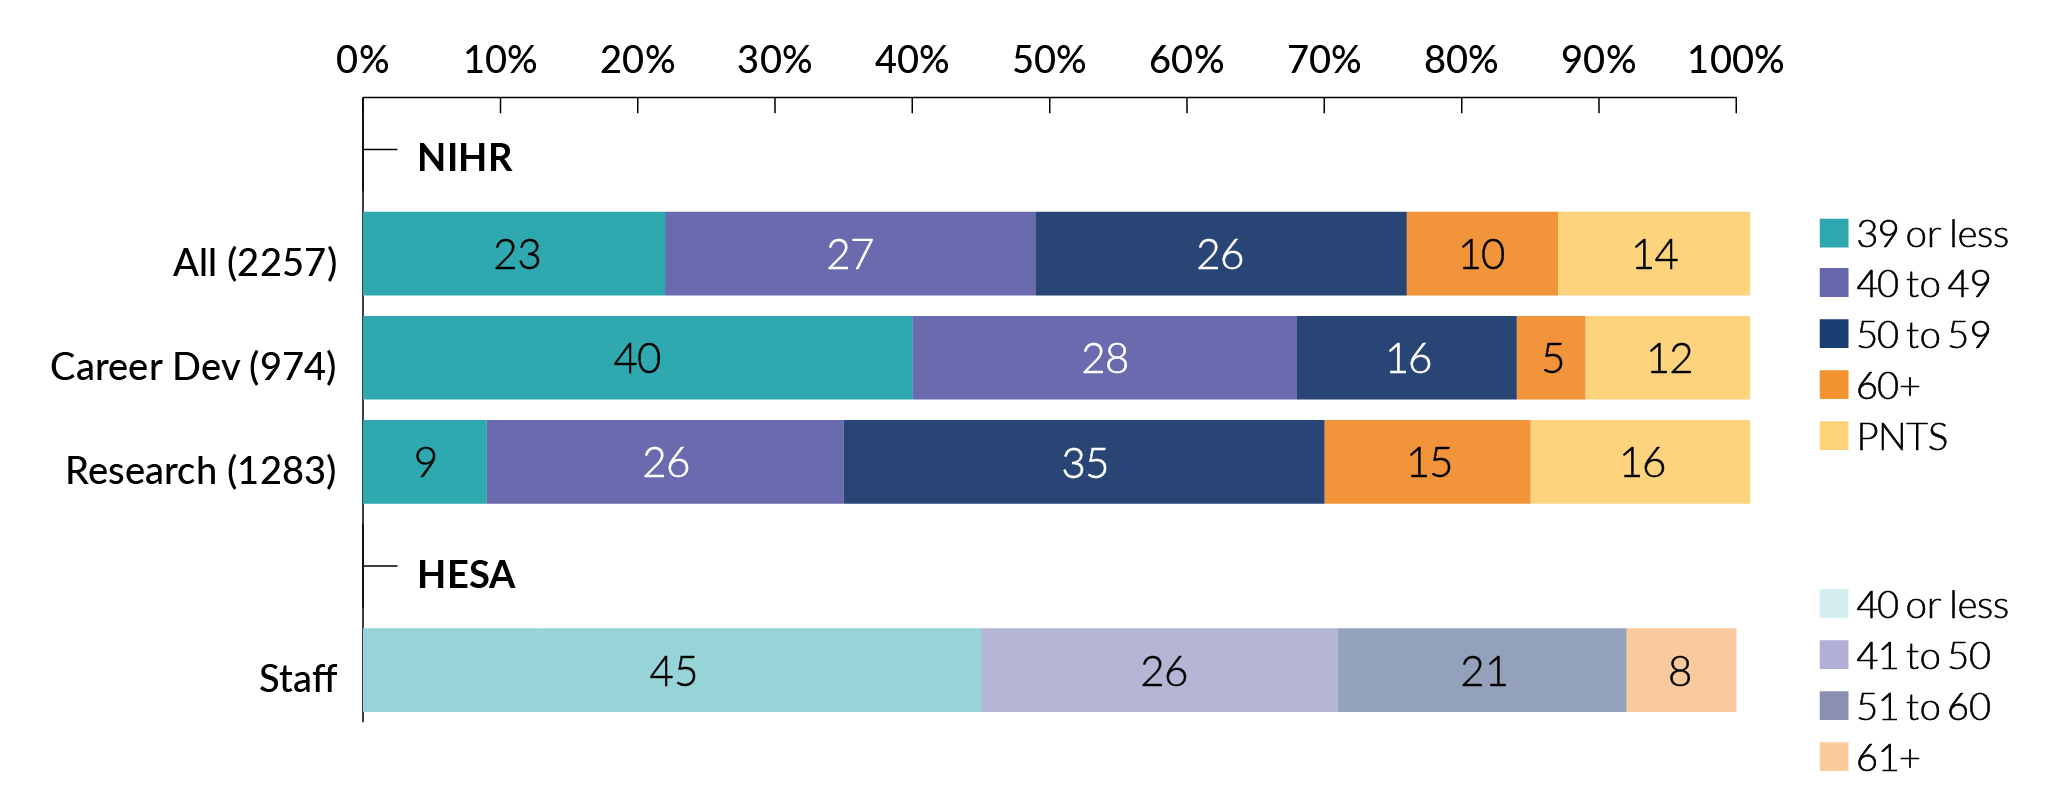
Programme type
- The mean age for NIHR award holders is 48, and those aged 40 to 49 are the best-represented age range (27% of award holders).
- 68% of award holders for career development programmes are <49 years old.
- 49% of award holders for research programmes are >50 years old.
- The differences in age for career development and research programmes are to be expected. By design, there is much more focus on early career researchers in the career development programmes. Research programmes require a strong research track record which typically advances with career stage (and thus age).
3.2 Disability
Chart 32. Disability status of our award holders by programme type

Chart 33. Disability status of our award holders by career stage
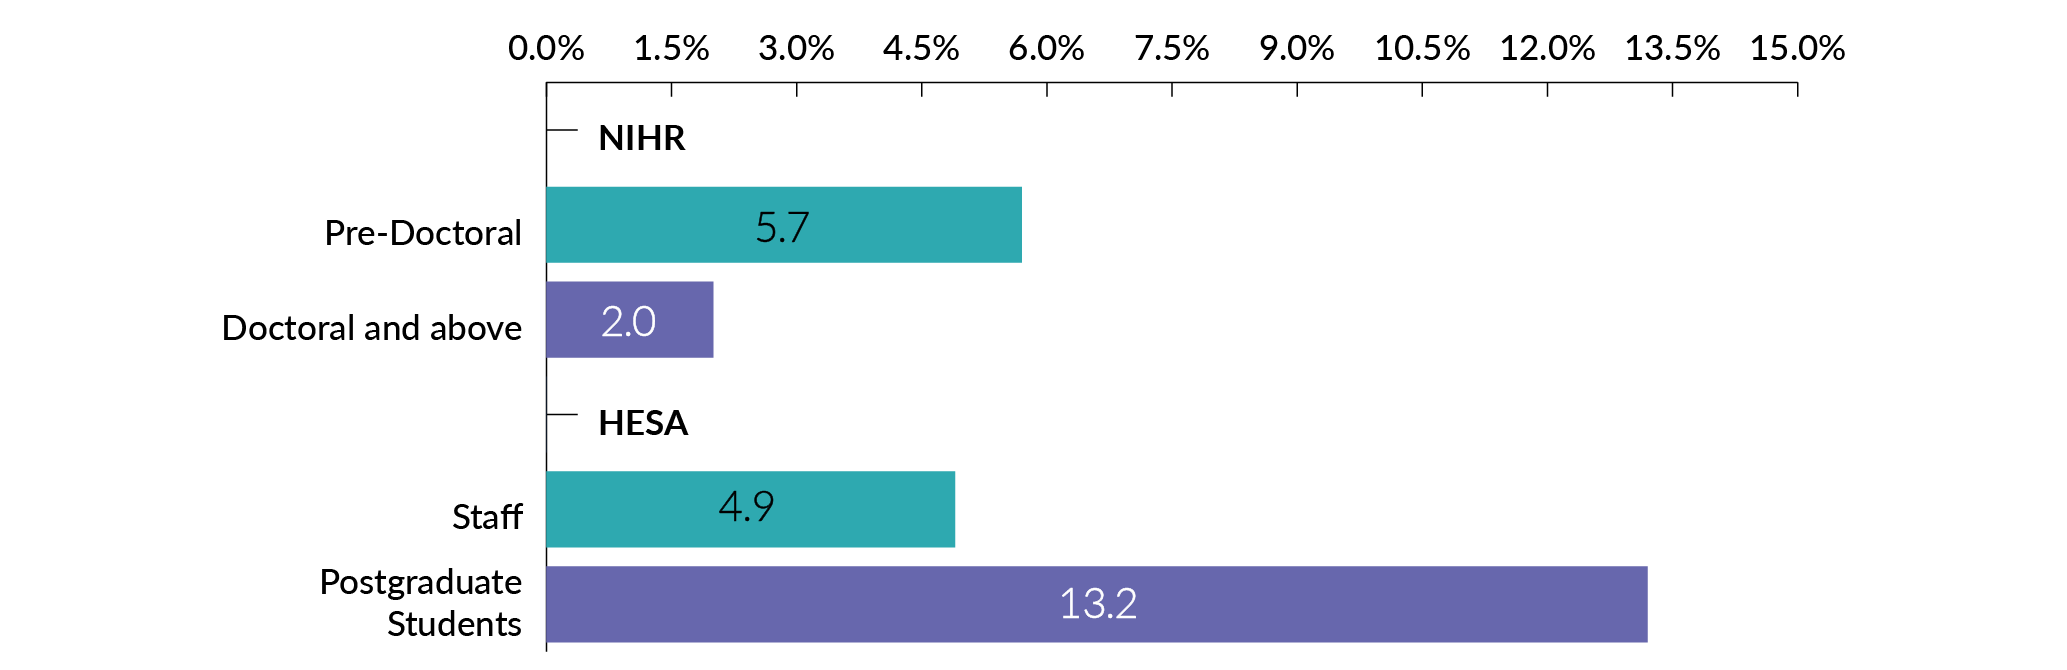
Programme type
- 3% of NIHR award holders declared having a disability, which is consistent across career development and research programmes and is lower than the number of HESA staff that declare having a disability (5%).
- Pre-doctoral award holders (6%) that declared a disability are far lower than the proportion of HESA postgraduate students that declared a disability (13%).
- The proportion of pre-doctoral award holders (6%) who declared a disability is much larger than the proportion of post-doctoral award holders (2%) who declared a disability.
- Some programmes, including the NIHR Professorship programme, had no award holders who declared a disability.
3.3 Ethnicity
Chart 34. Ethnicity of our award holders by programme type
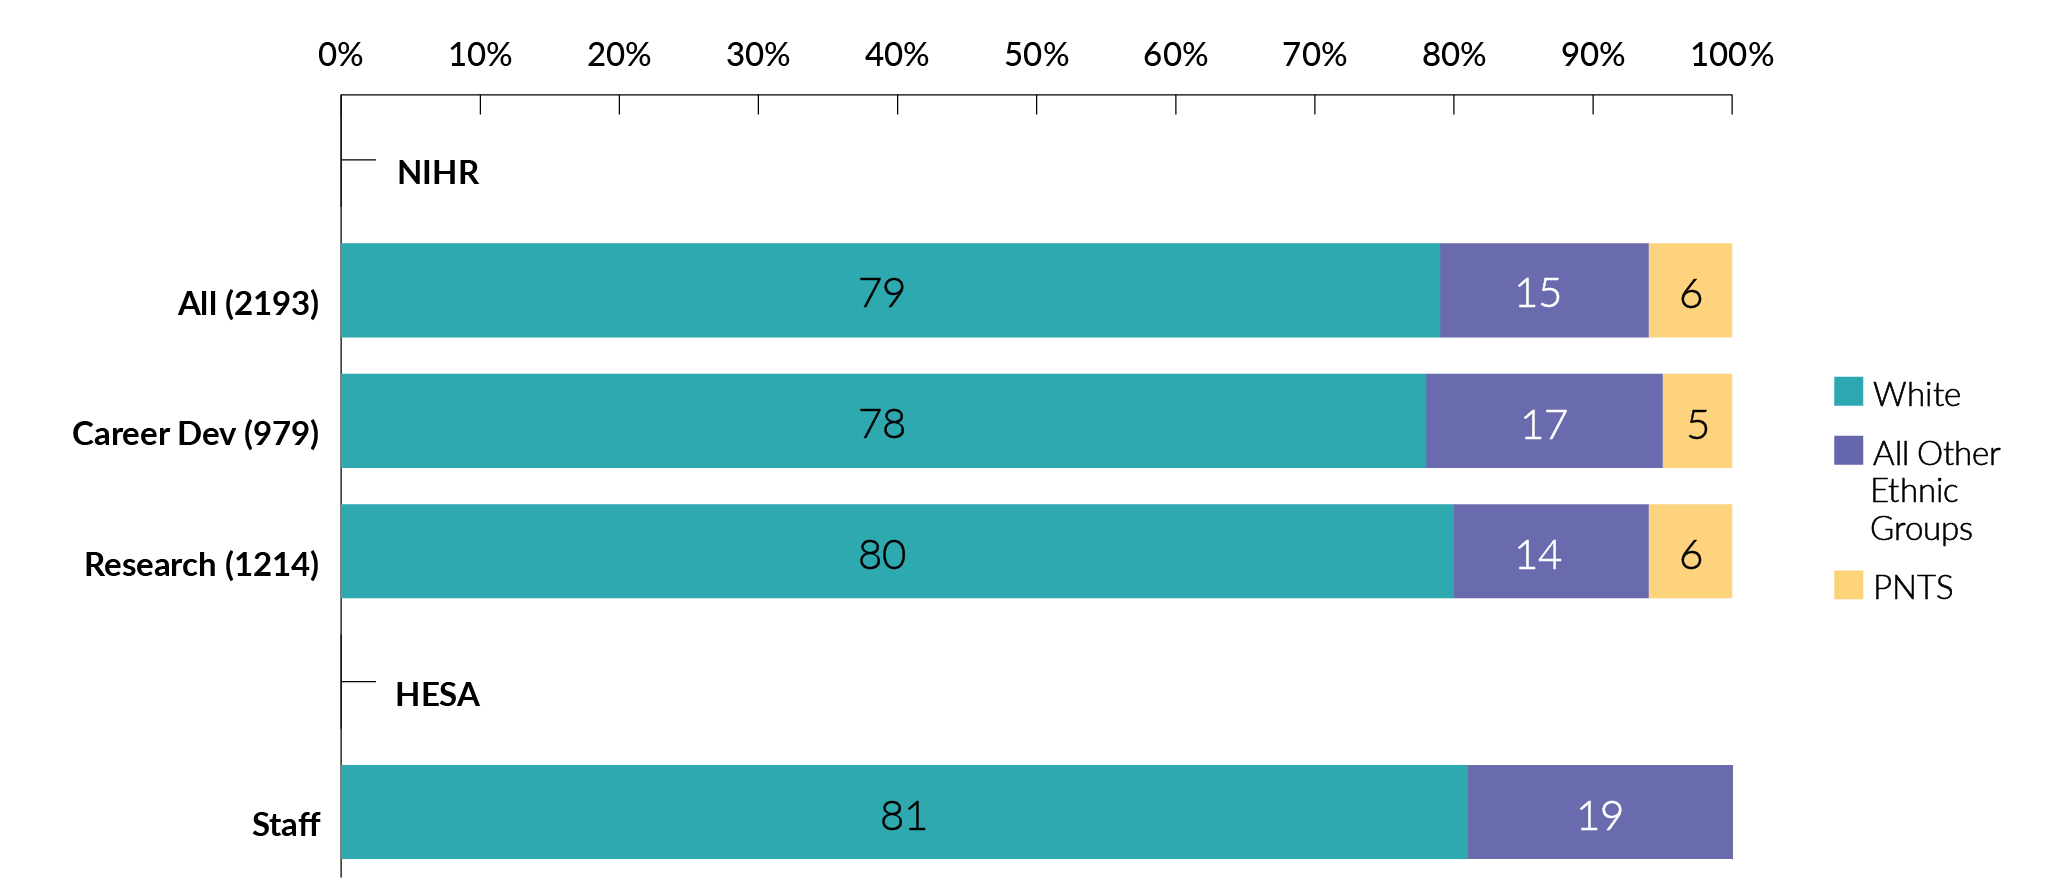
Programme type
- Overall 14-16% of NIHR award holders are from an ethnic minority background, this is lower than the proportion of HESA staff from ethnic minority backgrounds (19%).
- The proportion of Black award holders is lower than the HESA average. Representation of Black researchers is particularly low in career development programmes.
- The proportion of ethnic minority award holders varies by programme from 0 to 32%.
Chart 35. Ethnicity of our award holders across career development programmes by career stage
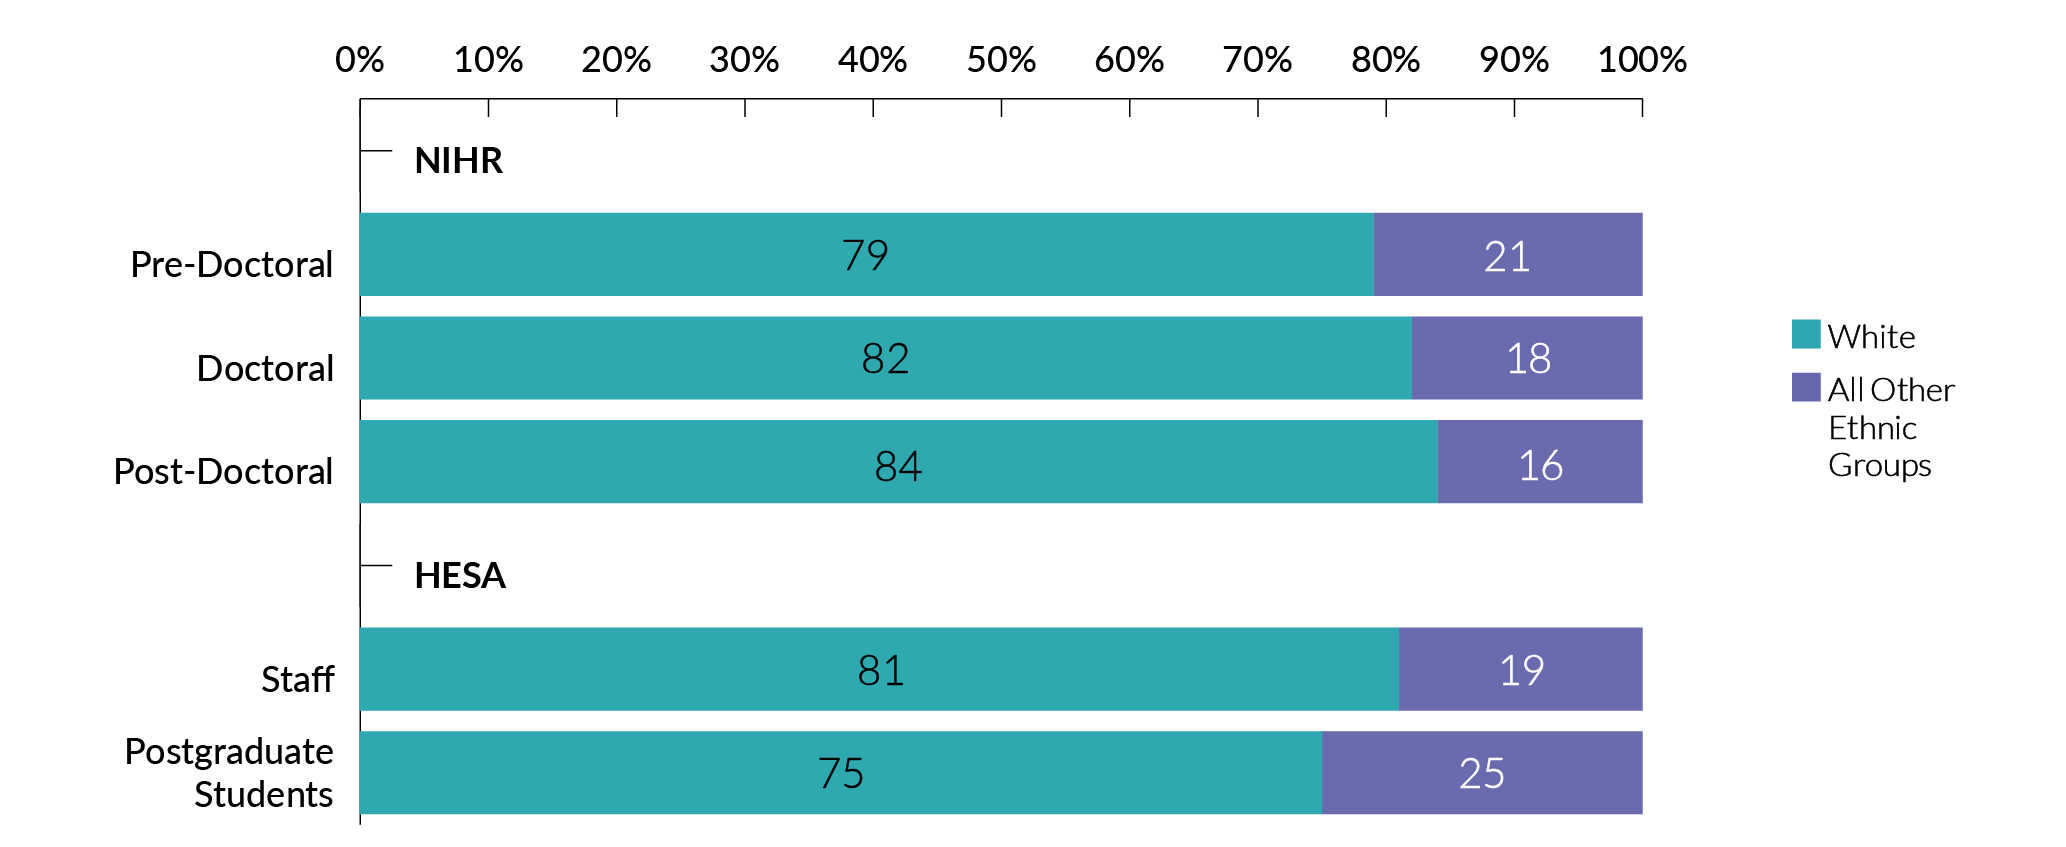
Career development programmes
- The proportion of award holders from ethnic minority backgrounds reduces by 5% from the pre-doctoral (21%) to the post-doctoral (16%) stage.
- While there are slightly higher percentages of award holders from ethnic minority backgrounds than in 2020/21, the decline in the representation of those from ethnic minority backgrounds with more advanced career stages remains.
3.4 Sex
Chart 36. Sex of our award holders by programme type
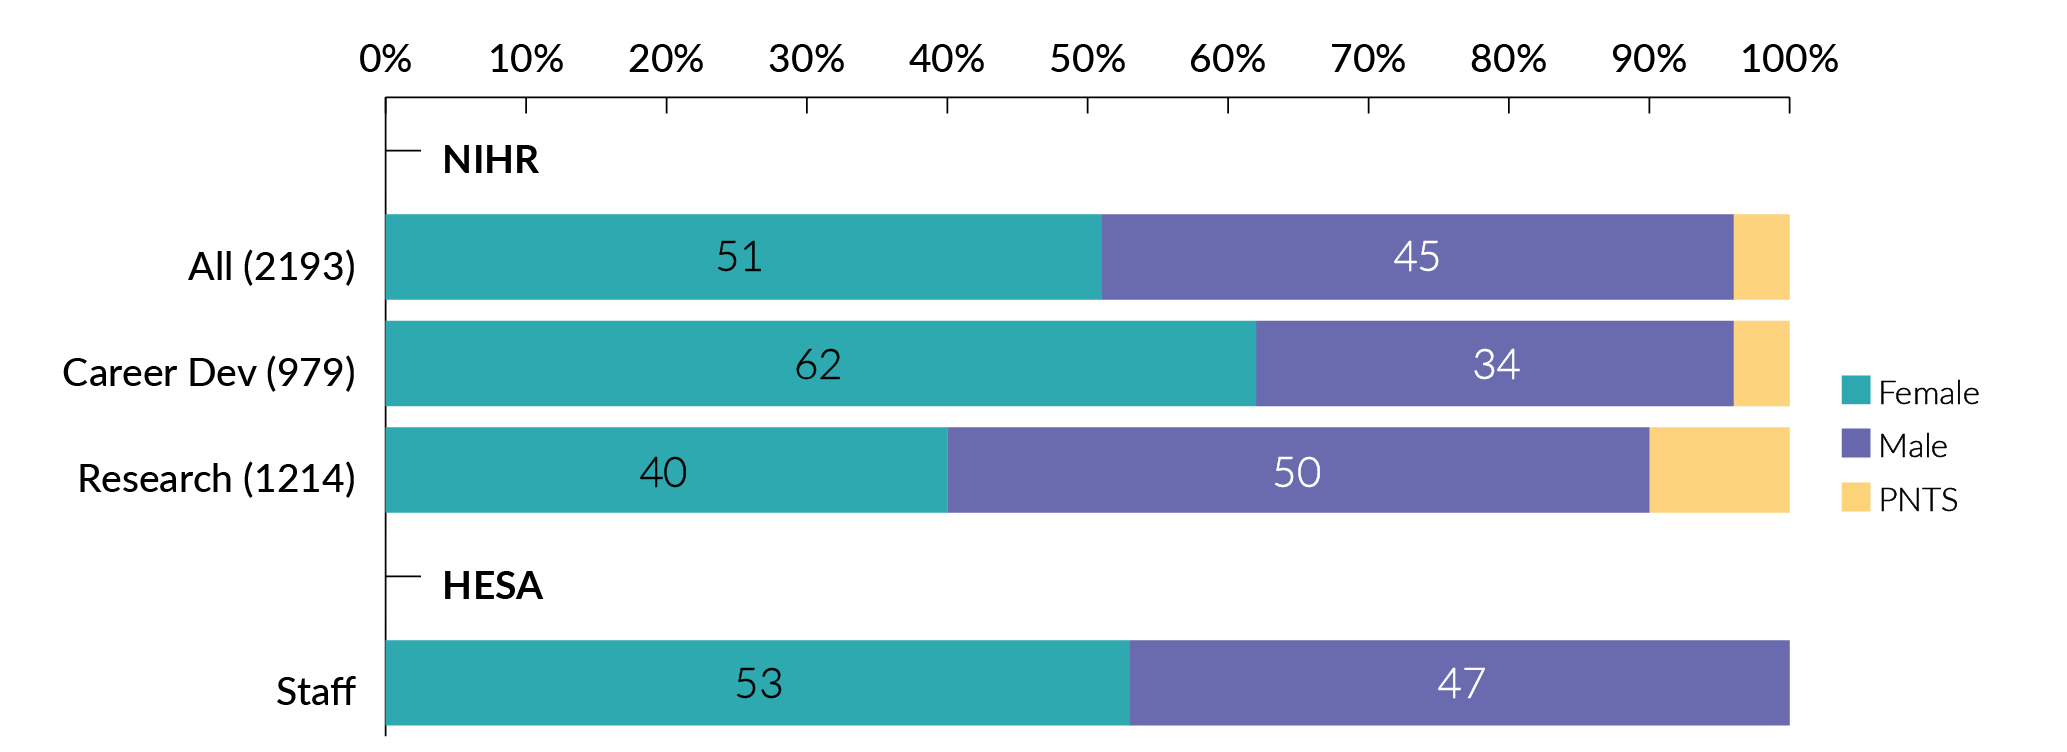
Programme type
- 51% of all award holders were female and 45% were male.
- For research programmes, 40% of award holders are female.
- Within the research programmes, female award holder proportions vary from 21% to 61% (data not shown).
Chart 37. Sex of our award holders across career development programmes by career stage
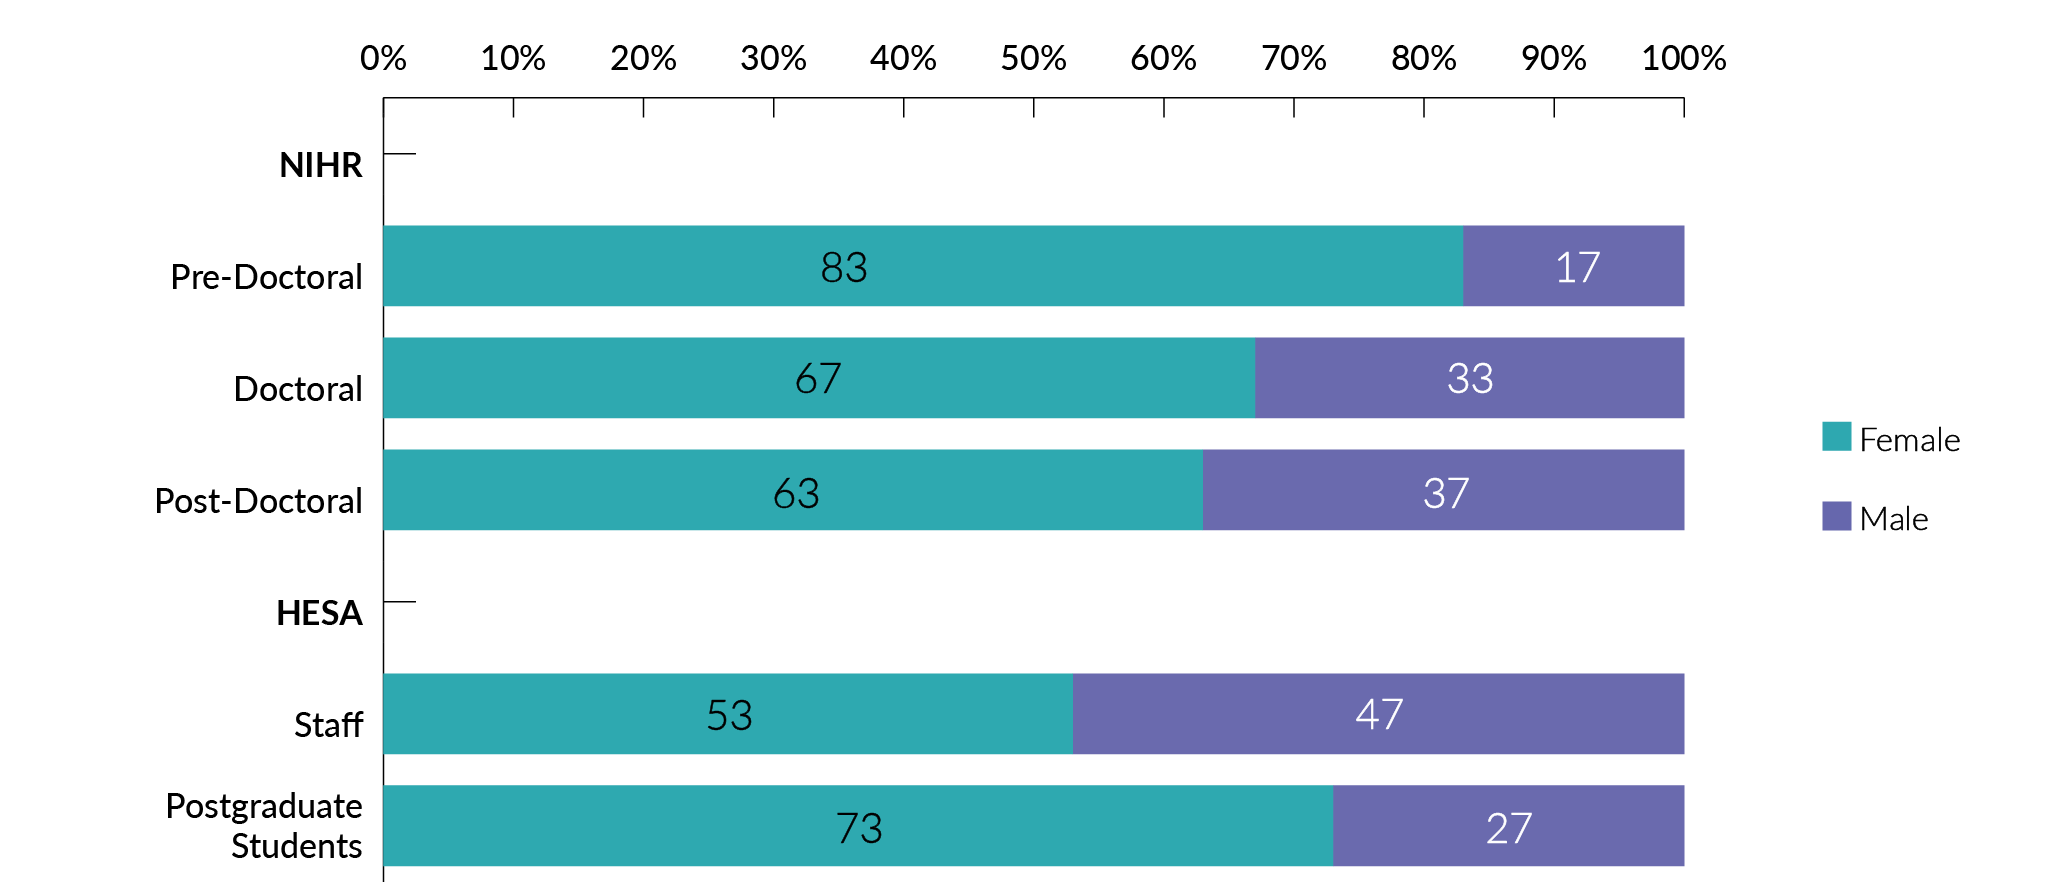
Career development programmes
- Overall, there are lower proportions of male career development award holders (34% across all career development programmes, see chart 36). However, this is most apparent in the pre-doctoral career stage where only 17% of applicants are male. However, this does not seem to preclude males from being more successful in research programmes.
- The proportion of female award holders declines sharply with increasing career stage, from 83% at the pre-doctoral stage, to 63% at the post-doctoral stage and 34% at the senior investigator level (data not shown).
Selection committees
4.1 Age
Chart 38. Age of our committee members by programme type
Programme type
- The average age for NIHR committee members is 53.
- Only 7% of committee members are <39 years old.
- Those aged 50 to 59 account for 36% of all committee members, 40% of career development members, and 34% of research programme committee members.
Chart 39. Age of our professional committee members
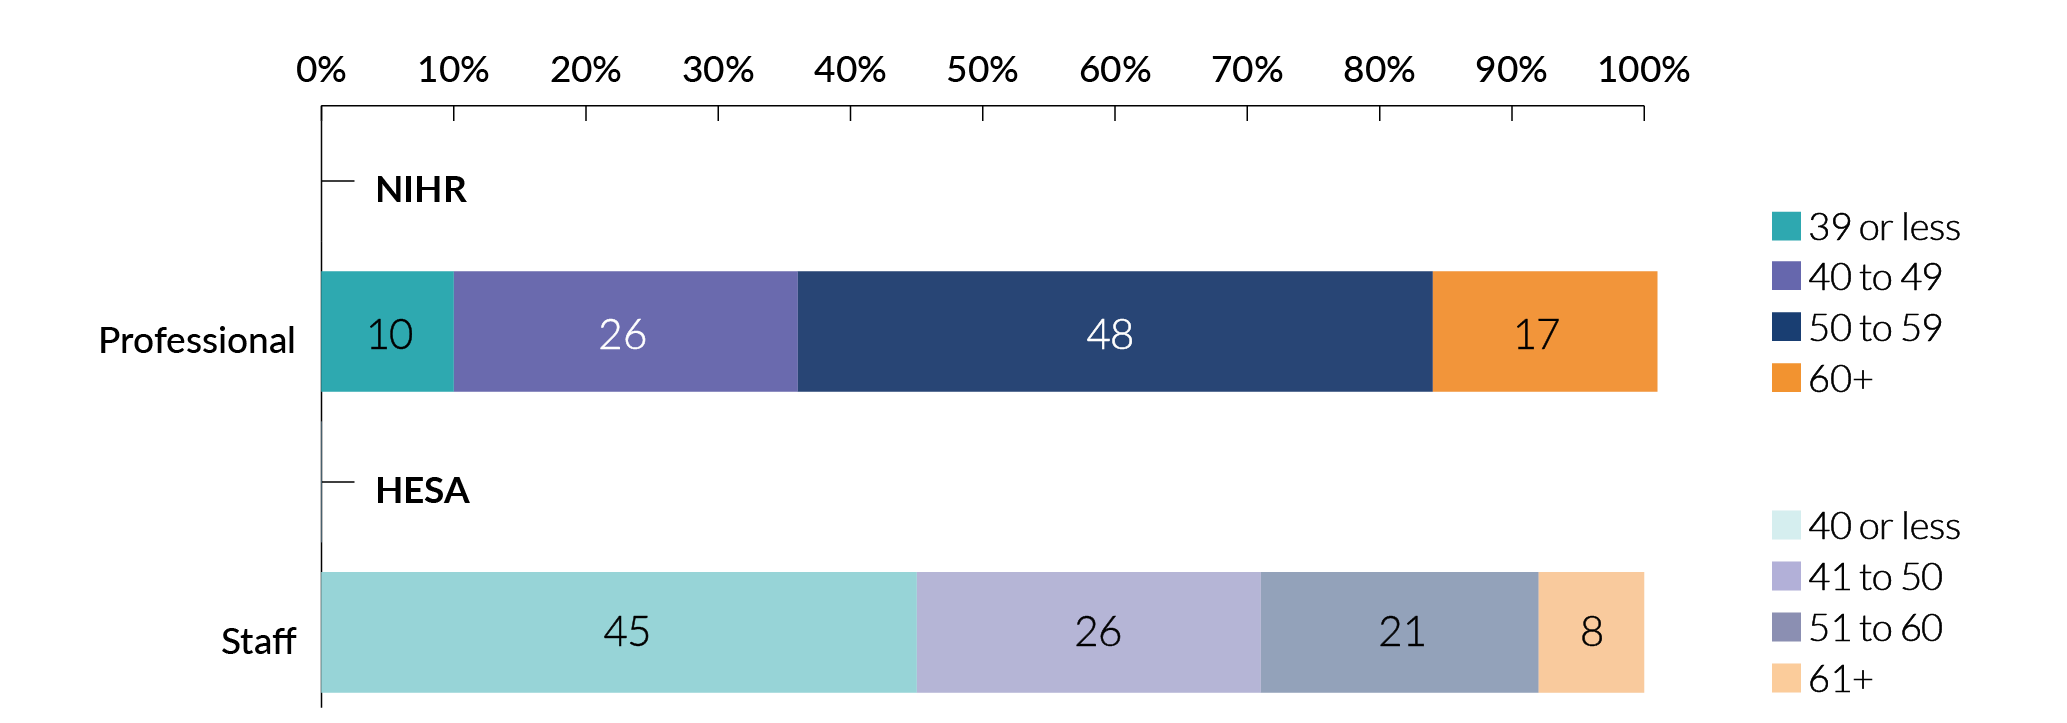
Chart 40. Age of our public committee members
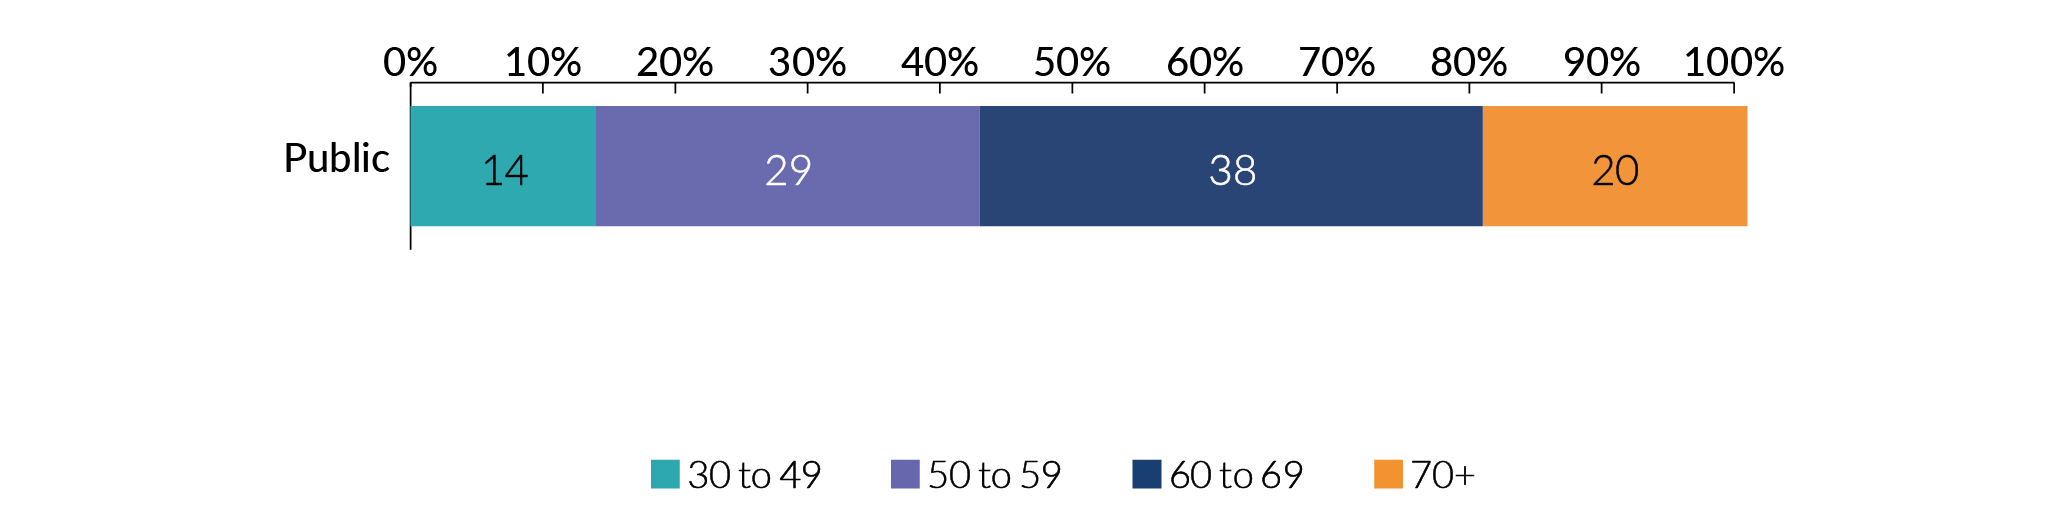
Professional and public members
- Compared to HESA data, professional committee members are on average from older age groups.
- Public members (62 years old) are 10 years older than professional members who have an average age of 52.
4.2 Disability
Chart 41. Disability status of our committee members by programme type
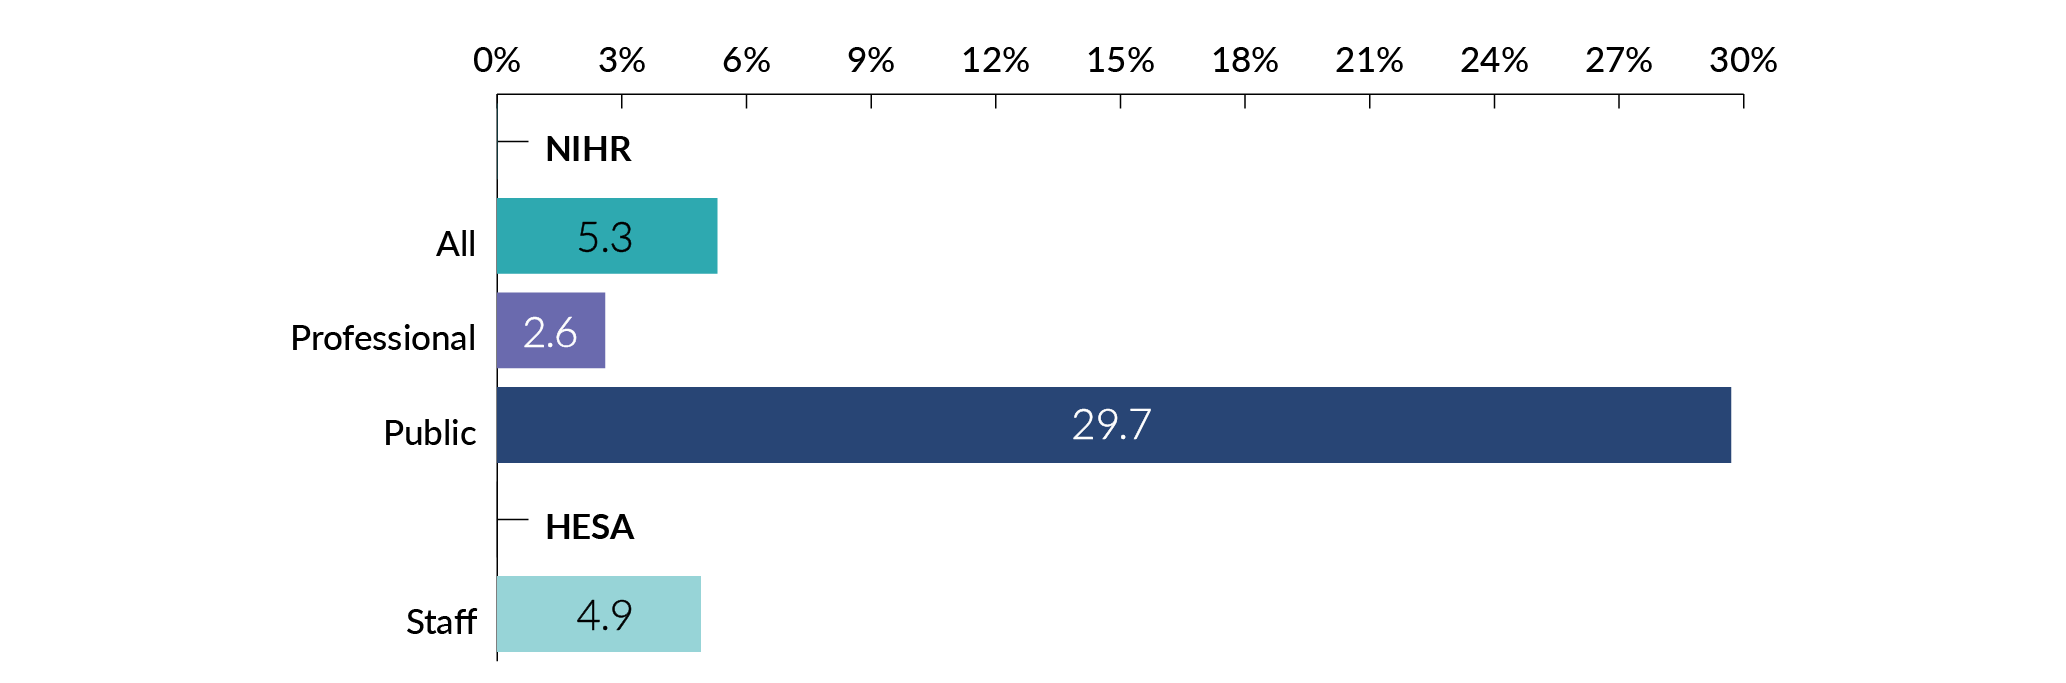
Chart 42. Disability status of our committee members according to role type

Programme type and role type
- The percentage of people who declared a disability on committees ranged from 3% on career development programmes, to 6% on research programmes.
- Only 3% of professional committee members declared a disability, which is 2% lower than the proportion of HESA staff that declared a disability.
- 30% of our public committee members declared a disability.
4.3 Ethnicity
Chart 43. Ethnicity of our committee members by programme type
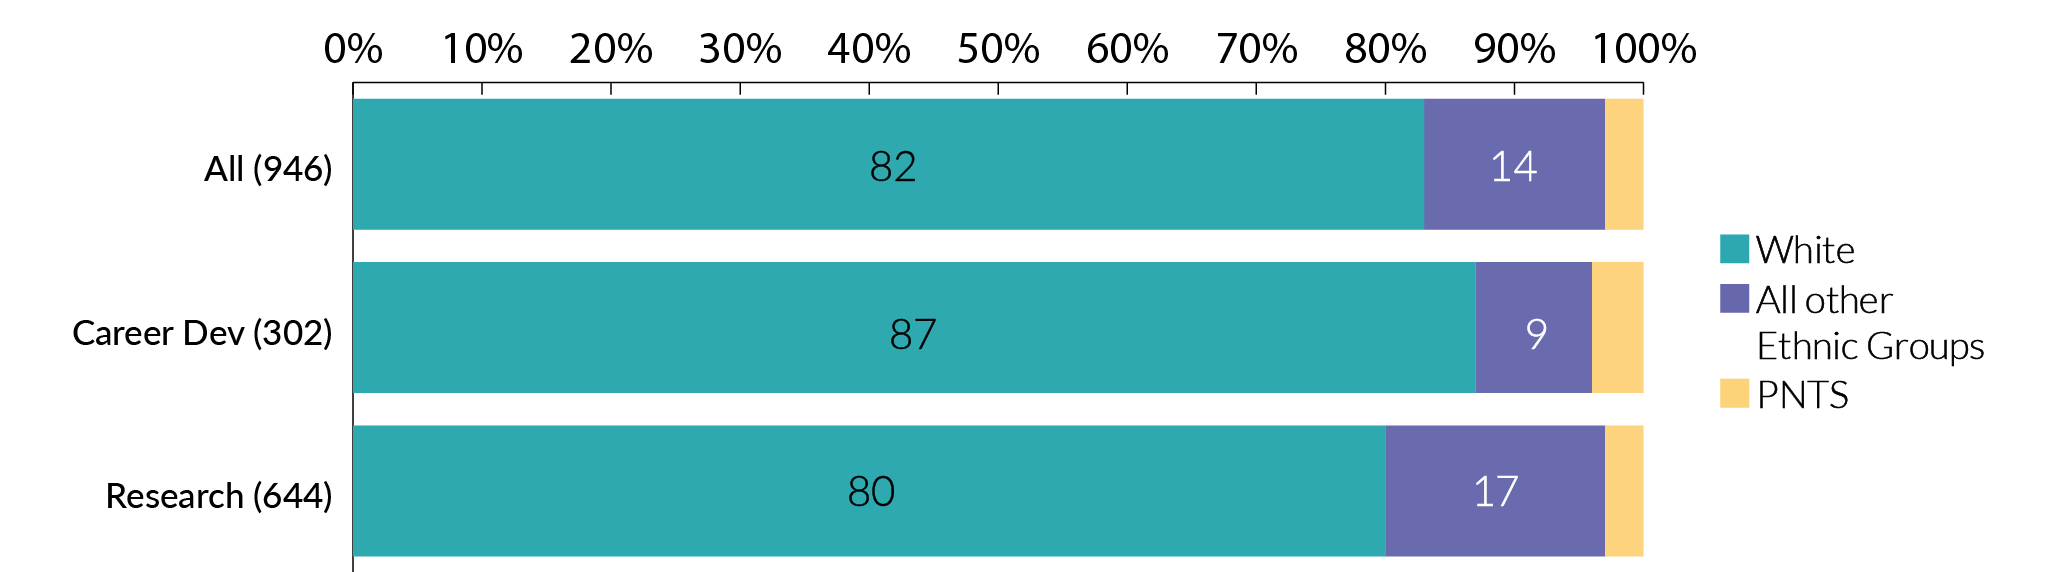
Chart 44. Ethnicity of all committee members from ethnic minority backgrounds

Programme type
- 14% of committee members are from an ethnic minority background, which is 5% less than those from an ethnic minority background in the HESA data.
- 9% of committee members are from an Asian background, which is 2% lower than the HESA data.
- Those from an ethnic minority background are under-represented on career development programme committees (9%), compared to research programme committee members (17%) and the HESA staff data (19%).
Chart 45. Ethnicity of our committee members according to role type
Role type
- There is a higher proportion of public committee members from an ethnic minority background (18%), than there are among professional members (14%).
4.4 Sex
Chart 46. Sex of our committee members by programme type
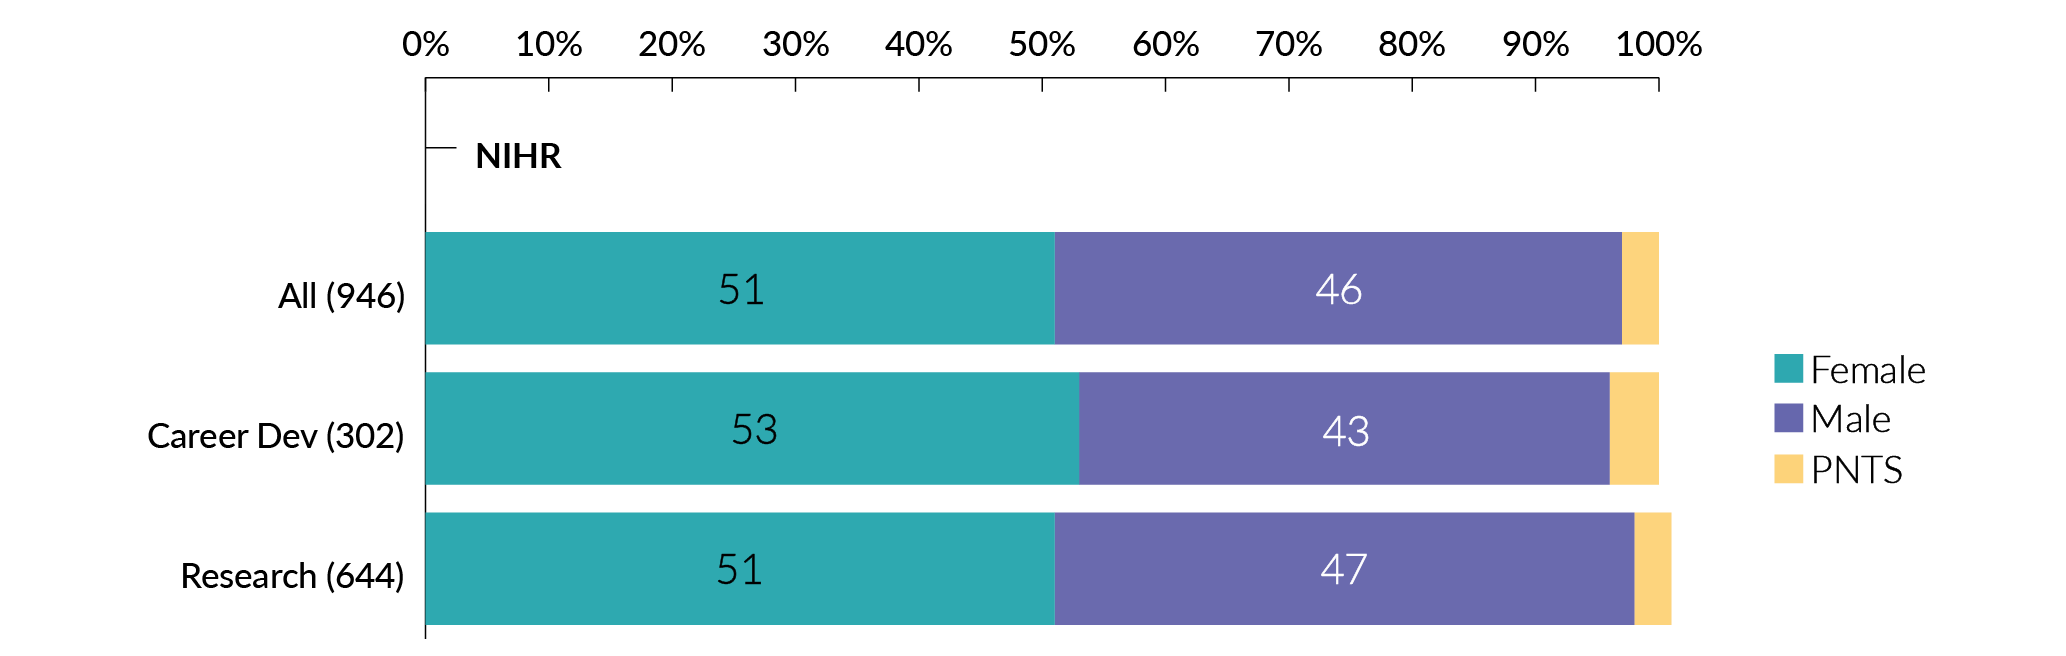
Chart 47. Sex of our committee members according to role type
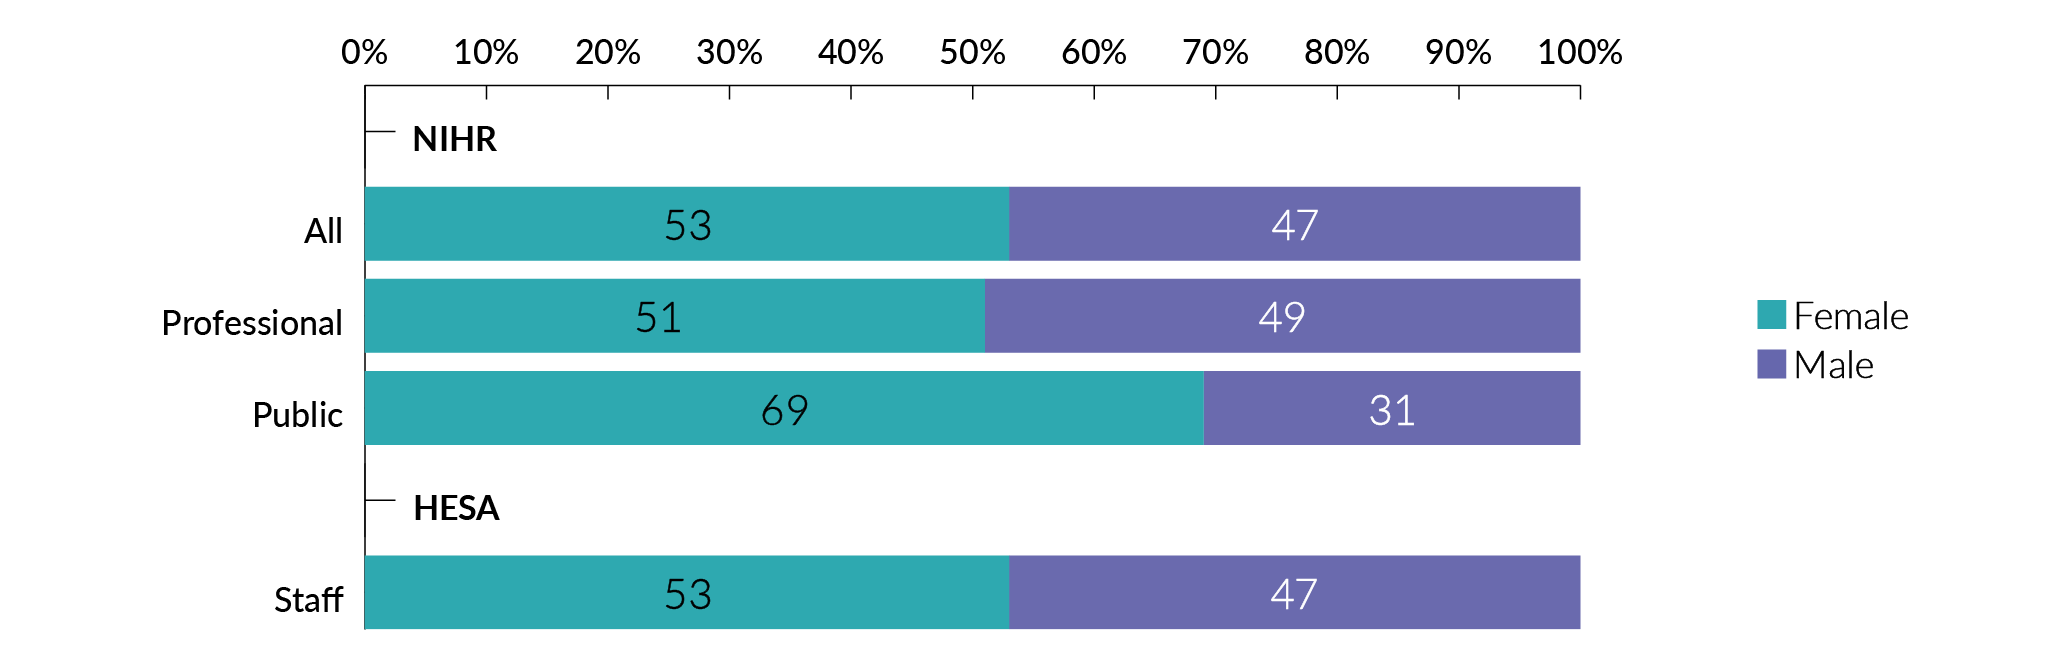
Programme type and role type
- There are higher percentages of female committee members for both research and career development committees.
- Almost 70% of public committee members are female.
Global health
Global health applications for funding
Chart 48. Who applies for Global health funding?
- Global health applicants have an older age profile than applicants to UK programmes. Applicants are 51 years old on average.
- As those declaring a disability have had to be combined with the ‘prefer not to say category’ we can’t comment specifically on applicants declaring a disability.
- There is a higher proportion of applicants that identify as Asian, Black, Mixed and Other ethnicities compared to our UK programmes.
- There is roughly an equal proportion of male and female applicants for Global health funding. This is an increase of 22% for female applicants compared to last year.
Global health award holders
Chart 49. Who are our Global health award holders?
- Award holders are more likely to be from older age groups when compared to Global health applicants and award holders from our UK programmes.
- A combined total of 3.5% of applicants either declared a disability or selected the prefer not to say response option. Last year no award holders declared having a disability or selected the prefer not to say option.
- There are fewer award holders from Asian, Black, Mixed or Other backgrounds compared to applicants.
- 38% of current award holders are female, a 12% increase compared to last year.
Global health committee members
Chart 50. Who sits on our Global health committees?
• The age profile of Global health committee members is older than committee members on our UK programmes.
• The proportion of committee members that did not declare a disability is 4% higher than UK programme committee members.
• The proportion of committee members selecting Asian, Black, Mixed and Other is higher than UK committee members. The White group still has the largest proportion of respondents.
• The proportion of female committee members (48%) has increased by 4% since last year.
Selected actions
Here we describe a selection of actions which relate to the key issues identified in this report. The implementation of some of the actions detailed here was initiated following our 2021 diversity data report. Our future plans and actions for improving our diversity data collection processes and methods can be found in our limitations and future plans section.
We are:
- Embedding an NIHR EDI training and development plan to improve EDI knowledge and competency of our workforce, and to promote inclusive practice and decision making.
- Developing a cross-NIHR process for Equality Impact Assessment use. This will help ensure that all NIHR activities are fair and do not present barriers, or disadvantage any groups from participation.
- Introducing positive action statements and accessibility statements in recruitment to committees and widened the reach of recruitment campaigns and advertisements, for example with our partnership with Black British Academics.
- Remaining committed to understanding the disparity in funding success between white applicants and those from ethnic minority groups. We will undertake further analysis exploring the link between application amount and funding success.
- Continuing to seek and work in partnership with organisations to improve the talent pipeline, for example, we will work with Melanin Medics to support pre-research programmes for students from underrepresented groups.
- Developing a Disability Framework which will ensure that disabled people feel welcome, included and supported to engage fully with NIHR.
- Reviewing the accessibility of the application processes and will develop adjustments to the application process to support applicants with a range of needs.
- Introducing NIHR’s approach to disaggregating sex and gender data in research to improve gendered health outcomes.
- Introducing diversity targets for professional members of funding committees so our committees are reflective of the diverse society they serve.
- Undertaking a full review of the recruitment, payment and support processes available for public committee members.
- Undertaking a scoping activity to identify the most appropriate approach for monitoring EDI data for Global health Research.
Our full EDI Strategy 2022-27 action plan will set out our key areas of focus over the next 2 years in full.
About NIHR
The NIHR’s mission is to improve the health and wealth of the nation through research. We deliver against this mission through six core workstreams:
- We fund high quality, timely research that benefits the NHS, public health and social care.
- We invest in world-class expertise, facilities and a skilled delivery workforce to translate discoveries into improved treatments and services.
- We partner with patients, service users, carers and communities, improving the relevance, quality and impact of our research.
- We attract, train and support the best researchers to tackle complex health and care challenges.
- We collaborate with other public funders, charities and industry to shape a cohesive and globally competitive research system.
- We fund applied Global health research and training to meet the needs of the poorest people in low and middle-income countries.
To contact us regarding our work to improve equality, diversity and inclusion, get in touch at edi@nihr.ac.uk